Western Digital 2011 Annual Report Download - page 3
Download and view the complete annual report
Please find page 3 of the 2011 Western Digital annual report below. You can navigate through the pages in the report by either clicking on the pages listed below, or by using the keyword search tool below to find specific information within the annual report.-
 1
1 -
 2
2 -
 3
3 -
 4
4 -
 5
5 -
 6
6 -
 7
7 -
 8
8 -
 9
9 -
 10
10 -
 11
11 -
 12
12 -
 13
13 -
 14
14 -
15
-
16
-
17
-
18
-
19
-
20
-
21
-
22
-
23
-
24
-
25
-
26
-
27
-
28
-
29
-
30
-
31
-
32
-
33
-
34
-
35
-
36
-
37
-
38
-
39
-
40
-
41
-
42
-
43
-
44
-
45
-
46
-
47
-
48
-
49
-
50
-
51
-
52
-
53
-
54
-
55
-
56
-
57
-
58
-
59
-
60
-
61
-
62
-
63
-
64
-
65
-
66
-
67
-
68
-
69
-
70
-
71
-
72
-
73
-
74
-
75
-
76
-
77
-
78
-
79
-
80
-
81
-
82
-
83
-
84
-
85
-
86
-
87
-
88
-
89
-
90
-
91
-
92
-
93
-
94
-
95
-
96
-
97
-
98
-
99
-
100
 |
 |

Fiscal 2011 was a tough year in the hard drive industry with the
PC and HDD industries growth rates slowing off the unexpectedly
strong post recession year of 2010. The slowdown was driven by
a marked drop in consumer spending and increased competition
for share of consumer spending from devices like smartphones
and tablets. The result was a challenging pricing environment
for hard drives.
The HDD industry grew scal 2011 volumes 4% to 657 million
units, while WD again grew faster than the industry at 6%,
shipping 207 million hard drives for the year — a 1% share gain.
This reafrms customer preference for WD’s value proposition
of providing a reliable supply of high quality storage solutions
at a competitive price with superior customer service. Revenue
declined year-over-year, reecting the challenging pricing
environment amid slower demand in both the consumer and
commercial industry sectors.
Our business continued to be a consistent generator of cash
in scal 2011. We further strengthened our balance sheet and
continued to make critical investments in technologies and
infrastructure to support our industry leadership position, to drive
market expansion in our existing businesses as well as in our
newer market entries like traditional enterprise and the digital
connected home. We exited the scal year with cash and cash
equivalents of $3.5 billion.
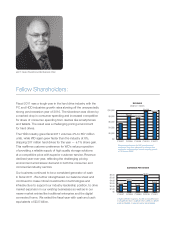
John F. Coyne, President and Chief Executive Ofcer
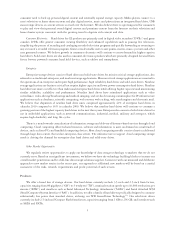
REVENUE
Dollars in millions
$8,074
$0
$2,000
$4,000
$6,000
$8,000
$10,000
FY2007 FY2008 FY2009 FY2010 FY2011
$7,453
$5,468
$9,850 $9,526
Customer preference for WD products and
continued long-term demand for storage has
resulted in compounded annual revenue growth
of 15% since 2007.
$0
$1.00
$2.00
$3.00
$4.00
$5.00
$6.00
FY2007 FY2008 FY2009 FY2010 FY2011
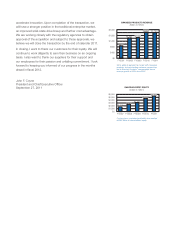
EARNINGS PER SHARE
$2.08
$5.93
$3.09
$2.50
$3.84
A highly efcient business model and experienced
management team underpin WD’s ability to deliver
solid protability in any economic environment.
Fellow Shareholders: