Washington Post 2015 Annual Report Download - page 5
Download and view the complete annual report
Please find page 5 of the 2015 Washington Post annual report below. You can navigate through the pages in the report by either clicking on the pages listed below, or by using the keyword search tool below to find specific information within the annual report.-
 1
1 -
 2
2 -
 3
3 -
 4
4 -
 5
5 -
 6
6 -
 7
7 -
 8
8 -
 9
9 -
 10
10 -
 11
11 -
 12
12 -
 13
13 -
 14
14 -
 15
15 -
 16
16 -
17
-
18
-
19
-
20
-
21
-
22
-
23
-
24
-
25
-
26
-
27
-
28
-
29
-
30
-
31
-
32
-
33
-
34
-
35
-
36
-
37
-
38
-
39
-
40
-
41
-
42
-
43
-
44
-
45
-
46
-
47
-
48
-
49
-
50
-
51
-
52
-
53
-
54
-
55
-
56
-
57
-
58
-
59
-
60
-
61
-
62
-
63
-
64
-
65
-
66
-
67
-
68
-
69
-
70
-
71
-
72
-
73
-
74
-
75
-
76
-
77
-
78
-
79
-
80
-
81
-
82
-
83
-
84
-
85
-
86
-
87
-
88
-
89
-
90
-
91
-
92
-
93
-
94
-
95
-
96
-
97
-
98
-
99
-
100
-
101
-
102
-
103
-
104
-
105
-
106
-
107
-
108
-
109
-
110
-
111
-
112
-
113
-
114
-
115
-
116
-
117
-
118
-
119
-
120
-
121
-
122
-
123
-
124
-
125
-
126
-
127
-
128
-
129
-
130
-
131
-
132
-
133
-
134
-
135
-
136
-
137
-
138
-
139
-
140
-
141
-
142
-
143
-
144
-
145
-
146
-
147
-
148
-
149
-
150
-
151
-
152
 |
 |

3
2015 ANNUAL REPORT
although not entirely, thanks to our wonderful TV
station group, Graham Media Group (GMG). The
average operating income margin for Graham
Holdings (before impairments of goodwill and other
long-lived assets and amortization of intangible
assets) over the last 3 years has been 7.9%.(1) In 2015,
we focused much eort on improving corporate
cost structures, both within subsidiaries and at the
parent level. We think these changes align well with
our decentralized operating model and in some cases
will yield operational improvements. We don’t view
this as a one-time eort, but rather a shift in our
operational thinking. Any cost that does not drive
revenue or enhance the quality of our products such
that it will improve revenue in the long run will be
ruthlessly scrutinized as to its necessity. Our view is
that companies that keep their non-strategic costs
lower than average will perform the best over time
when compared with their peers.
The divestitures, spin-o, and restructuring, when
combined with several accounting treatments
required by GAAP, made our underlying business
performance a bit more dicult to track than in
most previous years. We expect much of that heavy
lifting has been completed, and it will be much easier
to follow our business performance in 2016.
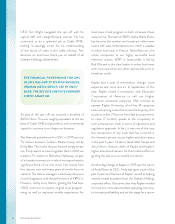
The Cable ONE spin-o deserves some additional
attention. As a business, Cable ONE made up
roughly half of the pre spin-o operating income and
one-third of the cash flow of Graham Holdings. It’s
nowhere near an overstatement to say that this was
a critically important decision for both the futures
of Cable ONE and GHC. When Graham Holdings
considers buying a business, one of the questions we
ask is, “Could we see ourselves owning this business
for the next 20 to 30 years?” The example of Cable
ONE, purchased in 1986, shows the wisdom in such
a question.
1ADJUSTED OPERATING INCOME MARGIN NONGAAP
(in thousands) 2015 2014 2013
Operating (Loss) Income, as reported $ (80,825) $ 232,720 $ 149,434
Plus: Impairment of Goodwill and Other Long-Lived Assets 259,700 17,302 3,250
Plus: Amortization of Intangible Assets 19,017 18,187 11,919
Adjusted Operating Income (non-GAAP) $ 197,892 $ 268,209 $ 164,603
Operating Revenues $ 2,586,114 $ 2,737,032 $ 2,600,602
Adjusted Operating Income Margin* (non-GAAP) 7.7% 9.8% 6.3%
Average Adjusted Operating Income Margin (non-GAAP) (2013-2015) 7.9%
*Adjusted Operating Income Margin (non-GAAP) is calculated as Adjusted Operating Income (non-GAAP) divided by Operating Revenues.
When graham holdIngs
consIders buyIng a busIness,
one of the questIons We ask
Is, “could We see ourselves
oWnIng thIs busIness for the
next 20 to 30 years?”