Wacom 2015 Annual Report Download - page 9
Download and view the complete annual report
Please find page 9 of the 2015 Wacom annual report below. You can navigate through the pages in the report by either clicking on the pages listed below, or by using the keyword search tool below to find specific information within the annual report.-
 1
1 -
 2
2 -
 3
3 -
 4
4 -
 5
5 -
 6
6 -
 7
7 -
 8
8 -
 9
9 -
 10
10 -
 11
11 -
 12
12 -
 13
13 -
 14
14 -
 15
15 -
 16
16 -
 17
17 -
 18
18 -
 19
19 -
 20
20 -
21
-
22
-
23
-
24
-
25
-
26
-
27
-
28
-
29
-
30
-
31
-
32
-
33
-
34
-
35
-
36
-
37
-
38
-
39
-
40
-
41
-
42
-
43
-
44
-
45
 |
 |

All Rights Reserved. Copyright © 2015 Wacom Co., Ltd. 9
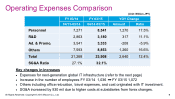
Operating Expenses Comparison
FY 03/14 FY 03/15 YOY Change
04/13-03/14 04/14-03/15 Amount Ratio
Personnel
7,271
8,541
1,270
17.5%
R&D
2,863
3,180
317
11.1%
Ad. & Promo.
3,541
3,333
-
208
-5.9
%
Others
7,593
8,853
1,260
16.6%
Total
21,268
23,908
2,640
12.4%
SG&A Ratio
27.1%
32.1%
Key changes in increases
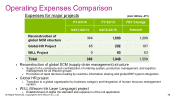
Expenses for next-generation global IT infrastructure (refer to the next page)
Increase in the number of employees FY 03/14 1,036 FY 03/15 1,072
Others including office relocation, travel expenses, and cost originated with IT investment.
SG&A increased by 930 mil due to higher costs at subsidiaries from forex changes.
(Unit: Million JPY)