Wacom 2015 Annual Report Download - page 6
Download and view the complete annual report
Please find page 6 of the 2015 Wacom annual report below. You can navigate through the pages in the report by either clicking on the pages listed below, or by using the keyword search tool below to find specific information within the annual report.-
 1
1 -
 2
2 -
 3
3 -
 4
4 -
 5
5 -
 6
6 -
 7
7 -
 8
8 -
 9
9 -
 10
10 -
 11
11 -
 12
12 -
 13
13 -
 14
14 -
 15
15 -
 16
16 -
 17
17 -
18
-
19
-
20
-
21
-
22
-
23
-
24
-
25
-
26
-
27
-
28
-
29
-
30
-
31
-
32
-
33
-
34
-
35
-
36
-
37
-
38
-
39
-
40
-
41
-
42
-
43
-
44
-
45
 |
 |

All Rights Reserved. Copyright © 2015 Wacom Co., Ltd. 6
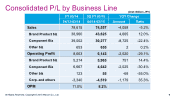
Consolidated P/L by Business Line
FY 03/14 3Q FY 03/15 YOY Change
04/13-03/14 04/14-03/15 Amount Ratio
Sales
78,615
74,557
-
4,058
-5.2
%
Brand Product biz
38,960
43,625
4,665
12.0%
Component Biz
39,002
30,277
-
8,725
-22.4
%
Other biz
653
655
2
0.2%
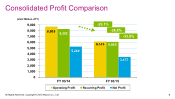
Operating Profit
8,663
6,143
-
2,520
-29.1
%
Brand Product biz
5,214
5,965
751
14.4%
Component Biz
6,667
4,642
-
2,025
-30.4
%
Other biz
123
55
-
68
-55.0
%
Corp. and others -
3,340
-
4,519
-
1,179
35.3%
OPM
11.0%
8.2%
(Unit: Million JPY)