Wacom 2013 Annual Report Download - page 8
Download and view the complete annual report
Please find page 8 of the 2013 Wacom annual report below. You can navigate through the pages in the report by either clicking on the pages listed below, or by using the keyword search tool below to find specific information within the annual report.-
 1
1 -
 2
2 -
 3
3 -
 4
4 -
 5
5 -
 6
6 -
 7
7 -
 8
8 -
 9
9 -
 10
10 -
 11
11 -
 12
12 -
 13
13 -
 14
14 -
 15
15 -
 16
16 -
 17
17 -
 18
18 -
 19
19 -
20
-
21
-
22
-
23
-
24
 |
 |

13 14
7.50
(3,000)
4,067
7,915
11,380
(14,860)
12,630
(21,961)
19,160
2,181
4,770
7,370
(9,511)
8,050
(14,055)
12,210
28,507 29,406
40,100
(51,148)
46,000
(68,896)
62,000
0
5,000
10,000
15,000
20,000
25,000
Operating income
Net income
Operating margin
ROE
ROA
0
10,000
20,000
30,000
40,000
50,000
60,000
70,000
0
10,000
20,000
30,000
40,000
50,000
60,000
70,000
11,683
31,056
47,200
(51,907)
43,400
(68,172)
57,000
11.25
(4,500)
17.50
(7,000)
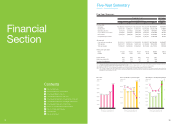
Dividend per share and payout ratio
() figures show dividends before a 400-for-1 share split
5.3 billion yen of the third party allocation transaction to Samsung on
February, 2013
11.7%
7.1%
19.9%
13.0%
11.3%
23.1%
13.8%
12.9%
(25.0%)
28.2%
(15.4%)
17.2%
(14.3%)
14.0%
(30.0%)
33.7%
(18.4%)
20.8%
(15.9%)
16.0%
10.0%
0
5
10
15
20
25
30
Operating income/Net income
Sales plan in Brand business Sales plan in Component business
Millions of yen
Millions of yen
Millions of yen
’12(actual) ’13(actual) ’14(forecast) ’15(plan) ’16(plan)
’12(actual) ’13(actual) ’14(forecast) ’15(plan) ’16(plan)
’12(actual) ’13(actual) ’14(forecast) ’15(plan) ’16(plan)
0%
5.0%
10.0%
15.0%
20.0%
25.0%
30.0%
35.0%
Key financial indicators Shareholder returns
Yen
’12(actual) ’13(actual) ’14(forecast) ’15(plan) ’16(plan)’12(actual)
30
40
50
60
54.9
37.7
39.9
’13(actual) ’14(forecast) ’15(plan) ’16(plan)
0
60,000
120,000
140,000
20,000
40,000
80,000
100,000
40,706
61,068
88,000
(103,955)
90,300
(138,068)
120,000
() figures show plans reflected by the change in the
assumption of foreign exchange rates.
() figures show plans reflected by the change in the
assumption of foreign exchange rates.
() figures show plans as of March 30, 2013
() figures show plans reflected by the change in the
assumption of foreign exchange rates.
() figures show plans reflected by the change in the
assumption of foreign exchange rates.
Effect of the change in
foreign exchange rates Effect of the change in
foreign exchange rates
Other business
Component business
Brand business
Net Sales
Millions of yen
’12(actual) ’13(actual) ’14(forecast) ’15(plan) ’16(plan)
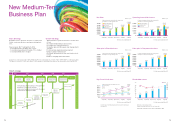
Payout ratio to be 40% or more by FY ended March, 2016
配当性向 %
Assumption of exchange rate: 1USD= 90JPY, 1EURO=115JPY (revised from initial rates of 1USD= 75JPY, 1EURO=100JPY as of October 25, 2012)
*The figures of forecasts of FY 2014 ended March 31, 2014 and plans of New Medium-Term Business Plan were announced as of April 30, 2013.
Basic Strategy
Expand business platform from PC to mobile and
Cloud, create new business and grow existing busi-
ness.
Financial goals: By FY ending March, 2016
・Consolidated sales: 120 billion JPY or more
・Consolidated operating profit margin: 15% or higher
・Consolidated ROE: 30% or higher
Growth Strategy
・Expand business platform from PC to mobile and
Cloud
・Accelerate the Branded product business
・Accelerate the Component business
・Strengthen global SCM (supply chain management)
structure
・Promote global organizational development
・Enhance global IT infrastructure
・Accelerate development of new user interface tech-
nology
・Enhance emerging market investment
For the years ended March 31 For the years ended March 31
For the years ended March 31 For the years ended March 31
For the years ended March 31 For the years ended March 31
Growth strategy
Input
market
20021995 2007 2010 2012 Near
future
Tablet market
Toward becoming the de facto standard for the Digital Paper era
Electronic
seals and
other security
applications
Pen sensor
components
Interactive
pen displays
Pen input
Touch sencer
components
Digital pen,
Stylus pen,
and Applications
Mobile products
Broadband Multi-touch Cloud
Ubiquitous
Standard Support
on Windows Vista OS
e-Learning,
Rich Digital Contents,
Informtion Security etc.
Standard Support
on Windows 7 OS,
Android OS
Ink communication
Standard Support
on Android 4.0 OS,
Windows 8 OS
Digital Paper,
Multifunctional
Terminals, Tablet PCs etc.
Development and Sales
・Strengthening of the leadership in Pen tablet field
・Expansion of components business
・Improvement and global development of branding
・New business development, R&D
New Medium-Term
Business Plan