Wacom 2013 Annual Report Download - page 11
Download and view the complete annual report
Please find page 11 of the 2013 Wacom annual report below. You can navigate through the pages in the report by either clicking on the pages listed below, or by using the keyword search tool below to find specific information within the annual report.-
 1
1 -
 2
2 -
 3
3 -
 4
4 -
 5
5 -
 6
6 -
 7
7 -
 8
8 -
 9
9 -
 10
10 -
 11
11 -
 12
12 -
 13
13 -
 14
14 -
 15
15 -
 16
16 -
 17
17 -
 18
18 -
 19
19 -
 20
20 -
 21
21 -
 22
22 -
23
-
24
 |
 |

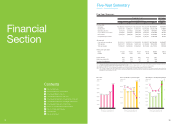
18,041
24,235
’09 ’10 ’11
(Millions of yen)
0
10,000
20,000
30,000
40,000
60,000
70,000
50,000
’12 ’13 ’09 ’10 ’11 ’12 ’09 ’10 ’11
(Millions of yen) (%) (Millions of yen) (%)
0
5,000
10,000
15,000
25,000
20,000
30
35
40
45
50
55
’13
0
1,000
2,000
5
3,000
4,000
8,000
7,000
5,000
6,000
0
10
15
’12
(For the year’s ended March 31) (For the year’s ended March 31) (For the year’s ended March 31)
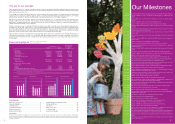
Net sales
Operating income/Operating margin
Gross profit/Gross profit margin
Five-Year Summary
Wacom Co., Ltd. and Its Subsidiaries
40,706
33,809 33,075
32,045
9.8
3,284
’13
4,067
7,915
47.4
16,761
49.6 48.9
4,311
12.8
9.8
3,128
For the year:
Net sales
Gross profit
Operating income
Income before income taxes
Net income
Comprehensive income
At year end:
Cash and cash equivalents
Total assets
Total net assets
Net income per share:
Basic
Diluted
Equity ratio(%)
Return on equity (%)
Number of employees
$649,315
257,685
84,158
80,232
50,723
62,415
$229,627
532,953
310,596
$0.32
0.32
Five-Year Summary
Thousands of
U.S. dollars
Year ended
March 31
2013
¥33,809,138
16,761,164
4,311,378
4,179,661
2,579,025
-
¥11,014,114
25,631,057
17,796,487
¥15.53
15.49
69.4
14.2
637
¥32,044,578
15,668,147
3,127,822
3,120,867
1,968,406
-
¥12,350,113
28,199,429
18,269,590
¥12.25
12.22
64.8
10.9
702
¥33,030,359
15,634,445
3,252,086
2,952,508
1,967,083
1,408,053
¥10,454,820
18,481,946
27,093,503
¥12.24
12.21
68.1
10.7
747
¥61,068,078
24,235,314
7,915,0 51
7,545,805
4,770,485
5,870,100
¥21,596,429
50,124,193
29,211,533
¥29.81
29.69
58.1
19.9
930
Thousands of yen
Year ended March 31
2009 2011 2013
¥40,705,578
18,040,993
4,067,475
3,504,537
2,181,341
2,007,351
¥11,969,873
34,129,398
18,917,895
¥13.66
13.65
55.2
11.7
785
20122010
20
Note 1: The translation of Japanese yen amounts into U.S. dollar amounts is included solely for the convenience of the readers outside Japan and has been calculated at the rate of
JP\94.05 = U.S.$1.00, the approximate rate of exchange on March 31, 2013.
Note 2: Equity Ratio deducted 20,000 shares for 1.85BJPY in 2009. 3 F.Y. and 5,000 shares for 0.44BJPY in 2012. 3 F. Y. repurchesed as treasury stock.
Note 3: The figures in 2011. 3 F. Y. were recalculated retroactively because of the adoption of the new accounting principles in revenue recognition.
Note 4: The Company conducted a stock split at a ratio of 400 to one based on the resolution of the Board of Directors held on April 30, 2013, resolved to adopt the stock split and the
unit share system, effective as of June 1, 2013. Net income per share and diluted net income per share have been calculated assuming that the stock split was conducted at the
beginning of the year ended March 31, 2009.
61,714
15,66715,668
44.0
39.7
10.0
13.0
Five-Year Summary
Overview of Business Performance
Consolidated Balance Sheets
Consolidated Statements of Income
Consolidated Statements of Comprehensive Income
20
21
24
26
27
Consolidated Statements of Changes in Net Assets
Consolidated Statements of Cash Flows
Notes to Consolidated Financial Statements
Report of Independent Auditor
28
29
30
43
Corporate data
44
Investor Information
45
Contents
Financial
Section
19