Wacom 2006 Annual Report Download - page 19
Download and view the complete annual report
Please find page 19 of the 2006 Wacom annual report below. You can navigate through the pages in the report by either clicking on the pages listed below, or by using the keyword search tool below to find specific information within the annual report.-
 1
1 -
2
-
3
-
4
-
5
-
6
-
7
-
8
-
 9
9 -
 10
10 -
 11
11 -
 12
12 -
 13
13 -
 14
14 -
 15
15 -
 16
16 -
 17
17 -
 18
18 -
 19
19 -
 20
20 -
 21
21 -
 22
22 -
 23
23 -
 24
24 -
 25
25 -
 26
26 -
 27
27 -
 28
28 -
 29
29 -
30
-
31
-
32
-
33
-
34
-
35
-
36
 |
 |

18
Financial Position
Financial conditions
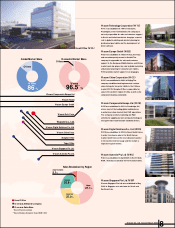
At the end of the fiscal year under review, consolidated cash
and cash equivalents increased by ¥6,109 million, or U.S.$52
million, an increase of ¥455 million, or U.S.$4 million for the
previous year, to ¥10,343 million, or U.S.$88 million, up 144.3%
year-on-year; while income before taxes grew to ¥3,401
million, or U.S.$29 million, up 98.0%, with proceeds from an
issuance of new shares reaching ¥4,356 million, or U.S.$37
million, compared to ¥134 million, or U.S.$1 million for the
previous fiscal year.
Cash flows from operating activities
N et cash provided by operating activities amounted to ¥2,270
million, or U.S.$19 million, up 95.4%, due primarily to strong
income before income taxes of ¥3,401 million, or U.S.$29 million,
despite payments of ¥1,075 million, or U.S.$9 million for income
taxes and other expenses.
Cash flows from investing activities
N et cash used in investing activities amounted to ¥93 million, or
U.S.$0.8 million compared to ¥24 million, or U.S.$0.2 million for
the previous fiscal year, due mainly to payment of ¥ 232 million, or
U.S.$2 million for purchases of fixed assets and proceeds of ¥67
million, or U.S.$0.6 million from sales of investment securities and
proceeds of ¥70 million, or U.S.$0.6 million from refunds due to
cancellation of insurance contracts.
Cash flows from financing activities
N et cash provided by financing activities amounted to ¥3,720
million, or U.S.$32 million in the term under review, while net
cash used by such activities amounted to ¥723 million, or U.S.$7
million in the previous fiscal year. This was primarily due to
proceeds of ¥4,356 million, or U.S.$37 million from an issuance
of new shares and the expenditure of ¥192 million, or U.S.$2
million for payment of cash dividends and the expenditure of
¥399 million, or U.S.$3 million for payment of long-term debt.
(Millions of yen)
(Millions of yen)
(Millions of yen)
Cash flows from operating activities
Cash flows from investing activities
Cash flows from financing activities
’02
124
’03
1,774
’05
1,162
’06
2,270
’04
1,069
’02
-153
’03
-1,039
’05
-723
’06
3,720
’04
-130
’02
-232
’03
-184
’05
-24
’06
-93
’04
-125
W acom Co., Ltd. Annual Report 2006
0
500
1,000
1,500
2,000
2,500
-250
-200
-150
-100
-50
0
-1,500
-1,000
-500
0
500
1,000
1,500
2,000
2,500
3,000
3,500
4,000