Wacom 2006 Annual Report Download - page 17
Download and view the complete annual report
Please find page 17 of the 2006 Wacom annual report below. You can navigate through the pages in the report by either clicking on the pages listed below, or by using the keyword search tool below to find specific information within the annual report.-
 1
1 -
2
-
3
-
4
-
5
-
6
-
 7
7 -
 8
8 -
 9
9 -
 10
10 -
 11
11 -
 12
12 -
 13
13 -
 14
14 -
 15
15 -
 16
16 -
 17
17 -
 18
18 -
 19
19 -
 20
20 -
 21
21 -
 22
22 -
 23
23 -
 24
24 -
 25
25 -
 26
26 -
 27
27 -
28
-
29
-
30
-
31
-
32
-
33
-
34
-
35
-
36
 |
 |

16
Market Environment and
Business Results
In the fiscal year under review, the Group operated under a
generally favorable business environment despite concerns such as
high international oil prices. In Japan, the economic recovery led to
strong personal spending, resulting in substantial growth in the
sales of home electronics, particularly flat-screen TVs, while the PC-
related market stayed relatively flat with a slightly higher sales
volume than in the previous year. The U.S. economy continued to
expand with sustained high growth in IT-related investment, thanks
to a steady gain in personal consumption, despite concerns over
an economic slowdown caused by surging oil prices and large-
scale destruction from hurricanes as well as other factors. In
Europe, amid moderate economic growth, there were signs of
steady recovery with broadening markets in Eastern Europe. In the
meantime, the Chinese market continued to grow reflecting its
robust economy. Asian markets other than Japan and China also
performed well.
Under these circumstances, the Group focused on higher market
recognition of professional pen tablets, the release of new models
and market expansion for consumer pen tablets, growth in
demand for professional interactive pen displays, an increase in
sales of pen sensor components for Tablet PCs, reinforcing
technological development, expanding operational bases in the
Asian and Pacific regions, and establishing a global supply chain
management (SCM) system.
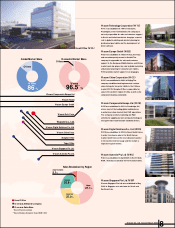
As a result of these efforts, the results of operations for the fiscal
year under review achieved net sales of ¥23,992 million, or
U.S.$204 million (up 35.9% year-on-year); operating income of
¥3,424 million, or U.S.$29 million (up 86.0% year-on-year) ; and net
income of ¥2,146 million, or U.S.$18 million (up 127.2% year-on-year).
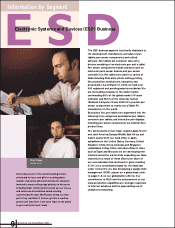
Business Results by Segment
Electronic Systems and D evices (ESD ) Business
The ESD business achieved steady growth across all product lines
and in all regions across the world during the term under review,
although performance varied somewhat by region. Sales in the U.S.
and European markets in particular reported significant increases,
benefiting from expansion of the market for digital cameras along
with the impact of launching new models. In terms of product lines,
Intuos3, our flagship product for professionals released in the
previous fiscal year, was highly acclaimed in the global market and
achieved a steady increase in sales. In addition, we launched new
models in the Graphire/FAVO series, a leading consumer product.
(Millions of yen)
’02 ’03 ’04 ’05
’02 ’03 ’04 ’05
N et income per share (basic)
(%)
(%)
RO E/ROA
Total shareholders' equity ratio
0
5,000
10,000
15,000
20,000
25,000
30,000
40.9 39.8
43.9
47.5
’06
63.2
7.0
4.7
4.3
1.0
’02
6,578
’03
28,089
’05
9,826
’06
5,421
’04
6,154
15.2
’06
12.2
21.5
11.1
10.6
(RO E)
(RO A)
2.5
N ote: Common shares were split on a five-for-one basis on
N ovember 20, 2003 and on a four-for- one basis on
N ovember 18, 2005.
W acom Co., Ltd. Annual Report 2006
N ote: RO A equals net income/average total assets.
Overview of Business Performance
W acom Co., Ltd. and Its Subsidiaries
0
5
10
15
20
25
20
30
40
50
60
70