Vtech 2016 Annual Report Download - page 13
Download and view the complete annual report
Please find page 13 of the 2016 Vtech annual report below. You can navigate through the pages in the report by either clicking on the pages listed below, or by using the keyword search tool below to find specific information within the annual report.-
 1
1 -
2
-
 3
3 -
 4
4 -
 5
5 -
 6
6 -
 7
7 -
 8
8 -
 9
9 -
 10
10 -
 11
11 -
 12
12 -
 13
13 -
 14
14 -
 15
15 -
 16
16 -
 17
17 -
 18
18 -
 19
19 -
 20
20 -
 21
21 -
 22
22 -
 23
23 -
24
-
25
-
26
-
27
-
28
-
29
-
30
-
31
-
32
-
33
-
34
-
35
-
36
-
37
-
38
-
39
-
40
-
41
-
42
-
43
-
44
-
45
-
46
-
47
-
48
-
49
-
50
-
51
-
52
-
53
-
54
-
55
-
56
-
57
-
58
-
59
-
60
-
61
-
62
-
63
-
64
-
65
-
66
-
67
-
68
-
69
-
70
-
71
-
72
-
73
-
74
-
75
-
76
 |
 |

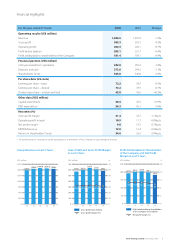
Trade debtors as of 31 March 2016 were US$230.3 million, increased from
US$221.9 million as of 31 March 2015. Debtor turnover days also increased from
57 days to 63 days. The Group has tight management on credit exposure. The
overdue balances greater than 30 days accounted for 2.2% of the gross trade debtors
as of 31 March 2016.
As at 31 March 2016 and 2015
All figures are in US$ million unless stated otherwise 2016 2015
Trade debtors 230.3 221.9
Average trade debtors as a percentage of
Group revenue 12.2% 11.5%
Turnover days 63 days 57 days
Other debtors, deposits and prepayments as of 31 March 2016 were US$35.9
million, decreased from US$38.0 million as of 31 March 2015. It was mainly
attributable to the decrease in fair value gain on forward foreign exchange contracts
in the financial year 2016.
Trade creditors as of 31 March 2016 were US$188.4 million, as compared to
US$186.1 million as of 31 March 2015. Creditor turnover days also increased from
85 days to 93 days.
As at 31 March 2016 and 2015
All figures are in US$ million unless stated otherwise 2016 2015
Trade creditors 188.4 186.1
Turnover days 93 days 85 days
Other creditors and accruals as of 31 March 2016 were US$156.9 million, increased
from US$156.5 million as of 31 March 2015.
Provisions for defective goods returns and other liabilities as of 31 March 2016
were US$31.5 million, as compared to US$27.3 million as of 31 March 2015.
Net obligations on defined benefit scheme as of 31 March 2016 were US$5.1
million, as compared to US$3.0 million as of 31 March 2015. The increase was mainly
due to the re-measurement of net liability of defined benefit scheme.
Treasury Policies
The Group’s treasury policies are
designed to mitigate the impact
of fluctuations in foreign currency
exchange rates arising from the Group’s
global operations. The Group principally
uses forward foreign exchange contracts
as appropriate to hedge the foreign
exchange risks in the ordinary course
of business. It is the Group’s policy not
to enter into derivative transactions for
speculative purposes.
Capital Expenditure
For the year ended 31 March 2016, the
Group invested US$38.3 million in the
purchase of tangible assets including
machinery and equipment, leasehold
improvements, office equipment, as well
as the improvement of manufacturing
working environment. All of these
capital expenditures were financed from
internal resources.
Capital Commitments and
Contingencies
In the financial year 2017, the Group will
incur capital expenditure of US$44.1
million for ongoing business operations.
These included the acquisition of the
tangible assets from Kenny Precision
Products (Shenzhen) Company Limited
to extend the vertical integration of
VTech CMS, and secure the supply of
high precision metal tooling and parts.
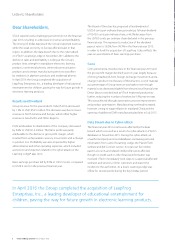
In addition, the Group has acquired
100% of the outstanding common
stock of LeapFrog subsequent to the
financial year 2016 for a consideration of
approximately US$72 million. LeapFrog
is a leading developer of educational
entertainment for children.
As of the financial year end date, the
Group had no material contingencies.
9VTech Holdings Limited Annual Report 2016