Vtech 2016 Annual Report Download - page 10
Download and view the complete annual report
Please find page 10 of the 2016 Vtech annual report below. You can navigate through the pages in the report by either clicking on the pages listed below, or by using the keyword search tool below to find specific information within the annual report.-
 1
1 -
 2
2 -
 3
3 -
 4
4 -
 5
5 -
 6
6 -
 7
7 -
 8
8 -
 9
9 -
 10
10 -
 11
11 -
 12
12 -
 13
13 -
 14
14 -
 15
15 -
 16
16 -
 17
17 -
 18
18 -
 19
19 -
 20
20 -
 21
21 -
22
-
23
-
24
-
25
-
26
-
27
-
28
-
29
-
30
-
31
-
32
-
33
-
34
-
35
-
36
-
37
-
38
-
39
-
40
-
41
-
42
-
43
-
44
-
45
-
46
-
47
-
48
-
49
-
50
-
51
-
52
-
53
-
54
-
55
-
56
-
57
-
58
-
59
-
60
-
61
-
62
-
63
-
64
-
65
-
66
-
67
-
68
-
69
-
70
-
71
-
72
-
73
-
74
-
75
-
76
 |
 |

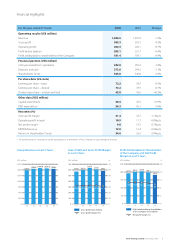
Financial Overview
For the year ended 31 March 2016 2016
US$ million
2015
US$ million
Change
US$ million
Revenue 1,856.5 1,879.8 (23.3)
Gross profit 583.3 610.5 (27.2)
Gross profit margin 31.4% 32.5%
Total operating expenses (381.0) (390.4) 9.4
Total operating expenses as a percentage of revenue 20.5% 20.8%
Operating profit 202.3 220.1 (17.8)
Operating profit margin 10.9% 11.7%
Net finance income 0.8 1.6 (0.8)
Profit before taxation 203.1 221.7 (18.6)
Taxation (21.7) (23.6) 1.9
Effective tax rate 10.7% 10.6%
Profit for the year and attributable to shareholders of the Company 181.4 198.1 (16.7)
Net profit margin 9.8% 10.5%
Revenue
Group revenue for the year ended 31 March 2016 reduced by 1.2% to US$1,856.5
million compared with the previous financial year. The decrease in revenue was
largely driven by lower sales in North America and Europe, which offset the increase in
revenue in Asia Pacific and other regions.
2016 2015 Increase/(decrease)
US$ million % US$ million % US$ million %
North America 878.3 47.3% 899.5 47.8% (21.2) -2.4%
Europe 795.9 42.9% 812.3 43.2% (16.4) -2.0%
Asia Pacific 129.0 6.9% 117.6 6.3% 11.4 9.7%
Other regions 53.3 2.9% 50.4 2.7% 2.9 5.8%
1,856.5 100.0% 1,879.8 100.0% (23.3) -1.2%
Gross Profit/Margin
Gross profit for the financial year 2016
was US$583.3 million, a decrease of
US$27.2 million or 4.5% compared to
the US$610.5 million recorded in the
previous financial year. Gross profit
margin for the year also reduced
from 32.5% to 31.4%. It was mainly
attributable to the depreciation of
foreign currencies against United States
Dollar and the change in product mix.
Cost of materials as percentage of Group
revenue was also higher due to these
factors, although the material costs
decreased slightly during the financial
year 2016.
As for the manufacturing overheads,
they increased over the last financial
year owing to the higher wages and
production capacity. Direct labour costs,
however, were lower despite the higher
wages in China during the financial
year 2016. It was mainly due to the
Group’s continuous efforts to reduce
the workforce through automation and
process improvement.
Operating Profit/Margin
Operating profit for the year ended
31 March 2016 was US$202.3 million,
a decrease of US$17.8 million or 8.1%
compared with the previous financial
year. It was mainly due to the decrease in
gross profit, which offset the decrease in
total operating expenses.
Operating Profit and Operating
Profit Margin in Last 5 years
US$ million
Operating profit (US$ million)
Operating profit margin (%)
12 13 14 15 16
209.5
223.9226.6
202.3
220.1
%
11.7 12.0 11.9 11.7
0
50
100
150
200
250
0
4
8
12
16
20
10.9
6 VTech Holdings Limited Annual Report 2016
Management Discussion and Analysis Financial Review