Vtech 2005 Annual Report Download - page 9
Download and view the complete annual report
Please find page 9 of the 2005 Vtech annual report below. You can navigate through the pages in the report by either clicking on the pages listed below, or by using the keyword search tool below to find specific information within the annual report.-
 1
1 -
 2
2 -
 3
3 -
 4
4 -
 5
5 -
 6
6 -
 7
7 -
 8
8 -
 9
9 -
 10
10 -
 11
11 -
 12
12 -
 13
13 -
 14
14 -
 15
15 -
 16
16 -
 17
17 -
 18
18 -
 19
19 -
 20
20 -
21
-
22
-
23
-
24
-
25
-
26
-
27
-
28
-
29
-
30
-
31
-
32
-
33
-
34
-
35
-
36
-
37
-
38
-
39
-
40
-
41
-
42
-
43
-
44
-
45
-
46
-
47
-
48
-
49
-
50
-
51
-
52
-
53
-
54
-
55
-
56
-
57
-
58
-
59
-
60
 |
 |

Management Discussion and Analysis
>>
>>
>>
>>
>>
>>
VTech Holdings Ltd Annual Report 2005 07
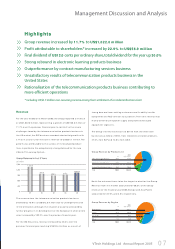
Highlights
Group revenue increased by 11.7% to US$1,022.0 million
Profit attributable to shareholders* increased by 22.9% to US$56.9 million
Final dividend of US12.0 cents per ordinary share, total dividend for the year up 30.0%
Strong rebound in electronic learning products business
Outperformance by contract manufacturing services business
Unsatisfactory results of telecommunication products business in the
United States
Rationalisation of the telecommunication products business contributing to
more efficient operations
* including US$6.7 million non-recurring income arising from settlement of an indemnification claim
>>
Revenue
For the year ended 31st March 2005, the Group reported a revenue
of US$1,022.0 million, representing a growth of US$106.8 million or
11.7% over the previous financial year. In contrast to the severe
challenges faced by the telecom m unication products business in
the US market, the ELP business recorded substantial grow th with
a 115.1% year on year increase in revenue to US$281.1 million. The
grow th was attributable to the success of its revamped product
lines, in particular the exceptionally strong demand for the new
V.Smile TV Learning System.
strong demand from existing customers and its ability to offer
comprehensive R&D services to customers. The rise in revenue w as
mainly driven by the power supply and professional audio
equipm ent segments.
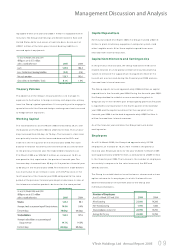
The Group's revenue continues to derive from the three core
businesses as follows: 59.9% from telecommunication products,
27.5% from ELP and 12.6% from CMS.
North America continues to be the largest m arket for the Group.
Revenue from this market accounted for 60.8% of the Group
revenue for the financial year 2005. Europe and Asia Pacific
accounted for 32.9% and 4.5% respectively.
The revenue from the telecommunication products business
declined by 10.9% to US$612.5 million due to underperformance
in the US market, although the situation was partly alleviated by
further progress in its development of the European market, where
sales increased by 102.2% over the previous financial year.
For the CMS business, revenue increased by 32.0% over the
previous financial year, reaching US$128.4 million as a result of
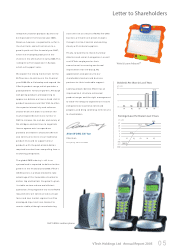
Group Revenue by Product Line
Group Revenue by Region