Vtech 2004 Annual Report Download - page 9
Download and view the complete annual report
Please find page 9 of the 2004 Vtech annual report below. You can navigate through the pages in the report by either clicking on the pages listed below, or by using the keyword search tool below to find specific information within the annual report.-
 1
1 -
 2
2 -
 3
3 -
 4
4 -
 5
5 -
 6
6 -
 7
7 -
 8
8 -
 9
9 -
 10
10 -
 11
11 -
 12
12 -
 13
13 -
 14
14 -
 15
15 -
 16
16 -
 17
17 -
 18
18 -
 19
19 -
 20
20 -
21
-
22
-
23
-
24
-
25
-
26
-
27
-
28
-
29
-
30
-
31
-
32
-
33
-
34
-
35
-
36
-
37
-
38
-
39
-
40
-
41
-
42
-
43
-
44
-
45
-
46
-
47
-
48
-
49
-
50
-
51
-
52
 |
 |

Management
Discussion and
Analysis
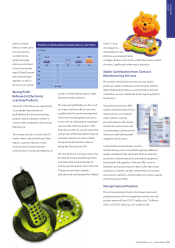
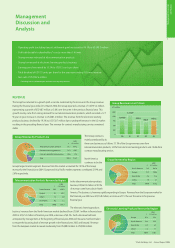
REVENUE
The Group has returned to a growth path as can be evidenced by the increase in the Group revenue.
During the financial year ended 31st March 2004, the Group reported a revenue of US$915.2 million,
representing a growth of US$48.7 million or 5.6% over the same in the previous financial year. This
growth mainly came from strong demand for our telecommunication products, which recorded a 12.7
% year on year increase in revenue to US$687.2 million. The revenue from the electronic learning
products business declined by 19.3% to US$130.7 million due to underperformance in the US market
resulting in the preceding financial year. The revenue for contract manufacturing services remained
stable.
The Group revenue is
mainly contributed by its
three core businesses as follows: 75.1% of the Group revenue came from
telecommunication products, 14.3% from electronic learning products and 10.6% from
contract manufacturing services.
North America
continues to be the
Group’s largest market segment. Revenue from this market accounted for 74.5% of the Group
revenue for the financial year 2004. Europe and Asia Pacific market segments contributed 21.9% and
2.6% respectively.
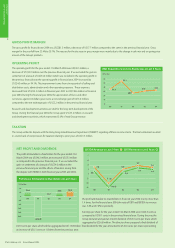
In the telecommunication products
business, US$622.2 million or 90.5%
of revenue came from sales in North
America. The business is, however, rapidly expanding in Europe. Revenue from the European market for
the financial year 2004 was US$55.8 million, an increase of 91.1% over the same in the previous
financial year.
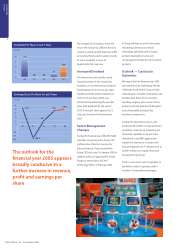
The electronic learning products
business’ revenue from the North American market declined from US$64.1 million in financial year
2003 to US$25.3 million in financial year 2004, a decrease of 60.5%. Such a decrease had been
anticipated by management at the beginning of financial year 2004 and measures had been taken
to ensure the bouncing back of revenue growth in the financial year 2005 and beyond. Revenue
from the European market increased moderately from US$88.0 million to US$99.8 million.
300
600
900
1,200
1,500
Group Revenue in Last 5 Years
US$ million
0
915.2
866.5
959.8
1,334.9
1,045.9
00 01 03 0402
Group Revenue by Product Line
%
2004
US$ million
Telecommunication products 75.1 687.2
Electronic learning products 14.3 130.7
Contract manufacturing services 10.6 97.3
Total 100.0 915.2
Group Revenue by Region
%
2004
US$ million
North America 74.5 681.8
Europe 21.9 200.3
Asia Pacific 2.6 23.4
Others 1.0 9.7
Total 100.0 915.2
Telecommunication Products Revenue by Region
%
North America 90.5 622.2
Europe 8.1 55.8
Others 1.2 8.0
Asia Pacific 0.2 1.2
Total 100.0 687.2
2004
US$ million
Electronic Learning Products Revenue by Region
%
Europe 76.3 99.8
North America 19.4 25.3
Asia Pacific 3.0 3.9
Others 1.3 1.7
Total 100.0 130.7
2004
US$ million
•Operating profit (excluding lawsuit settlement gain) increased by 94.1% to US$49.5 million
•Profit attributable to shareholders* rose by more than 1.4 times
•Strong revenue rebound at telecommunication products
•Strong turnaround at electronic learning products business
•Earnings per share raised by 13.3% to US20.5 cents per share
•Total dividend of US10.0 cents per share for the year, representing 1.8 times increase
•Net cash of US$102.6 million
*Excluding lawsuit settlement gain and non-recurring tax provisions
7
Management Discussion
and Analysis
VTech Holdings Ltd Annual Report 2004