Vtech 2004 Annual Report Download - page 11
Download and view the complete annual report
Please find page 11 of the 2004 Vtech annual report below. You can navigate through the pages in the report by either clicking on the pages listed below, or by using the keyword search tool below to find specific information within the annual report.-
 1
1 -
 2
2 -
 3
3 -
 4
4 -
 5
5 -
 6
6 -
 7
7 -
 8
8 -
 9
9 -
 10
10 -
 11
11 -
 12
12 -
 13
13 -
 14
14 -
 15
15 -
 16
16 -
 17
17 -
 18
18 -
 19
19 -
 20
20 -
 21
21 -
 22
22 -
23
-
24
-
25
-
26
-
27
-
28
-
29
-
30
-
31
-
32
-
33
-
34
-
35
-
36
-
37
-
38
-
39
-
40
-
41
-
42
-
43
-
44
-
45
-
46
-
47
-
48
-
49
-
50
-
51
-
52
 |
 |

9
Management Discussion
and Analysis
LIQUIDITY AND FINANCIAL
RESOURCES
The shareholders’ funds as at 31st March
2004 were US$162.6 million, a 27.5%
increase from the US$127.5 million
reported for financial year 2003. The net
assets per share increased by 27.6%
from US56.5 cents to US72.1 cents.
As at 31st March 2004, the Group had net
cash of US$102.6 million, as compared to
US$67.7 million as at 31st March 2003.
Total interest bearing liabilities were
US$2.6 million, of which US$0.6 million
was repayable within one year,
US$0.4 million was repayable
between one and two years, US$0.6
million was repayable between two
and five years and US$1.0 million
was repayable after five years. A
majority of the Group’s borrowing is
denominated in Euros and is on a
fixed-rate basis. An amount of
US$2.4 million of the total gross
interest bearing liabilities is secured
against land and buildings. The
gross debts to shareholders’ funds as at 31st March 2004 was 1.6% against 2.1% in the previous financial
year.
TREASURY POLICIES
The objective of the Group’s treasury
policies is to manage its exposure to
fluctuation in foreign currency exchange
rates arising from the Group’s global
operations and interest rates on its
interest bearing loans. It is our policy not
to engage in speculative activities.
Forward foreign exchange contracts and
interest rate swaps are used to hedge
certain exposures.
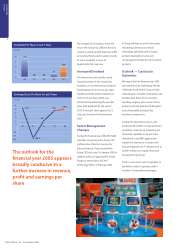
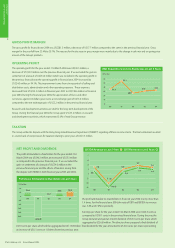
WORKING CAPITAL
The stock balance as at 31st March
2004 increased by 14.4% over the
balance at 31st March 2003 to US$96.1
million. The turnover days increased
from 63 days to 69 days. The trade
debtors balance as at 31st March 2004
was US$137.6 million, an increase of
11.9% as compared to that reported for
the previous financial year. The
turnover days fell from 71 days in the
previous financial year to 60 days in
financial year 2004.
CAPITAL EXPENDITURE
For the year ended 31st March 2004, the
Group invested US$19.5 million in plant,
machinery, equipment, computer systems
and other tangible assets. All of these
capital expenditure were financed from
internal resources.
CAPITAL COMMITMENTS AND CONTINGENCIES
During the year, the Group committed to the implementation of a new global enterprise resources planning
system to enhance the supply chain management. The total investment for the project is estimated at
approximately US$12 million in which US$3.0 million has been incurred in the financial year 2004. It will be
financed from internal resources.
As of the financial year end date, the Group had no material contingencies.
As at 31st March 2004 and 2003
All figures are in US$ million
unless stated otherwise 2004 2003
Stocks 96.1 84.0
Average stocks as a percentage of 9.8% 10.3%
Group revenue
Turnover days 69 days 63 days
Trade debtors 137.6 123.0
Average trade debtors as a 14.2% 14.5%
percentage of Group revenue
Turnover days 60 days 71 days
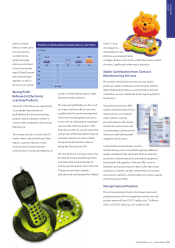
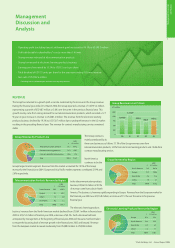
As at 31st March 2004, the Group had approximately 19,700 employees, an
increase of 6,200 from 13,500 in the previous financial year. Employee costs for
the year ended 31st March 2004 were approximately US$99 million, as compared
to US$90 million in the financial year 2003.
The Group has established an incentive bonus scheme and a share option
scheme for its employees, in which the benefits are determined based on the
performance of the Group and individual employees.
EMPLOYEES
Number of Employees
As at 31st March 2004 and 2003 2004 2003
Manufacturing 18,200 12,100
Non-manufacturing 1,500 1,400
Total employees at year end 19,700 13,500
Average for the year 18,700 15,600
Working Capital
As at 31st March 2004 and 2003
All figures are in US$ million
unless stated otherwise 2004 2003
Cash 105.2 70.4
Less: Total interest bearing liabilities (2.6) (2.7)
Net cash position 102.6 67.7
Gross debts to shareholders’ funds 1.6% 2.1%
Liquidity and Financial Resources
VTech Holdings Ltd Annual Report 2004