Vtech 2003 Annual Report Download - page 12
Download and view the complete annual report
Please find page 12 of the 2003 Vtech annual report below. You can navigate through the pages in the report by either clicking on the pages listed below, or by using the keyword search tool below to find specific information within the annual report.-
 1
1 -
 2
2 -
 3
3 -
 4
4 -
 5
5 -
 6
6 -
 7
7 -
 8
8 -
 9
9 -
 10
10 -
 11
11 -
 12
12 -
 13
13 -
 14
14 -
 15
15 -
 16
16 -
 17
17 -
 18
18 -
 19
19 -
 20
20 -
 21
21 -
 22
22 -
23
-
24
-
25
-
26
-
27
-
28
-
29
-
30
-
31
-
32
-
33
-
34
-
35
-
36
-
37
-
38
-
39
-
40
-
41
-
42
-
43
-
44
-
45
-
46
-
47
-
48
-
49
-
50
-
51
-
52
-
53
-
54
 |
 |

Management Discussion and Analysis
VTech Holdings Ltd
10
2003 GROUP REVENUE BY PRODUCT LINE (US$ million)
2003 GROUP REVENUE BY REGION (US$ million)
Telecommunication products 609.8
Electronic learning products 161.9
Contract manufacturing services 94.7
Other businesses 0.1
North America 680.3
Europe 149.5
Asia Pacific 29.2
Others 7.5
GROUP REVENUE IN LAST 5 YEARS
99
960.6
1,045.9
1,334.9
959.8 866.5
1,500
1,200
900
600
300
00 01 02 03
US$ million
• Improvement of net profit to
US$40.8 million
• Increased operating profit
(excluding lawsuit settlement)
by 10.9%
• Net cash of US$67.7 million
• Total dividend of US3.5 cents per
share
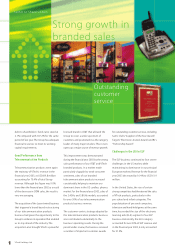
REVENUE The Group revenue for the year
ended 31st March 2003 was US$866.5
million, which represented a drop of 9.7%
from that of last year.The decline was mainly
attributable to the loss of ODM business of
telecommunication products in this
financial year, despite the substantial
growth of sales of AT&T and VTech branded
products in the same period.Lower sales at
the ELP business in the US market was
another major factor contributing to the
reduction in the Group revenue.
Telecommunication products accounted for
70.4% of total Group revenue to US$609.8
million for the year ended 31st March 2003.
As compared with last year, revenue
declined 9.0% mainly because of the
decrease in sales from ODM business. One
major customer exited the North America
telephone market in 2002, with the result
that this revenue did not recur in the
financial year 2003. However, the sales
performances of AT&T and VTech branded
phones were strong, especially in higher
margin 2.4GHz and 5.8GHz cordless phones
as consumers responded well to our new
range of products.The sales of the AT&T
and VTech branded products grew
considerably in the period under review
and captured a dominant share in the US
market. Currently, we are the largest player
in the cordless phone market in the United
States.
In the financial year 2003, the improved
product mix, i.e. shifting from 900MHz to
2.4GHz cordless phones, enabled the
business to enjoy better margin and higher
average selling price (ASP) as compared to
the financial year 2002. Sales derived from
our ODM business in the financial year 2003
accounted for less than 5% of total
telecommunication products revenue,
which is significantly lower than the
proportion of this revenue in the last
financial year.
RESULTS OVERVIEW
For the year ended 31st March 2003
All figures are in US$ million except those stated otherwise 2003 2002
Revenue 866.5 959.8
Operating profit 59.5 23.0
Profit attributable to shareholders 40.8 11.2
Non-recurring items affecting net results
— Gain on settlement of a lawsuit 34.0 —
— Tax provision for prior years under dispute (11.0) —
Basic earnings per share (in US cents) 18.1 5.0
Dividend per share (in US cents)
—Interim 1.5 Nil
— Final 2.0 Nil