Vtech 2001 Annual Report Download - page 5
Download and view the complete annual report
Please find page 5 of the 2001 Vtech annual report below. You can navigate through the pages in the report by either clicking on the pages listed below, or by using the keyword search tool below to find specific information within the annual report.-
 1
1 -
 2
2 -
 3
3 -
 4
4 -
 5
5 -
 6
6 -
 7
7 -
 8
8 -
 9
9 -
 10
10 -
 11
11 -
 12
12 -
 13
13 -
 14
14 -
 15
15 -
 16
16 -
17
-
18
-
19
-
20
-
21
-
22
-
23
-
24
-
25
-
26
-
27
-
28
-
29
-
30
-
31
-
32
-
33
-
34
-
35
-
36
-
37
-
38
-
39
-
40
-
41
-
42
-
43
-
44
-
45
-
46
-
47
-
48
-
49
-
50
-
51
-
52
-
53
-
54
-
55
-
56
-
57
-
58
-
59
-
60
-
61
-
62
-
63
-
64
-
65
-
66
-
67
-
68
-
69
-
70
-
71
-
72
 |
 |

VTech Holdings Ltd Annual Report 2001
3
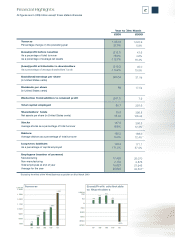
Financial Highlights
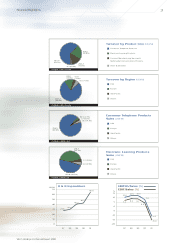
Turnover by Region (US$’M)
USA
Europe
Asia Pacific
Others
USA
Europe
Asia Pacific
Others
USA
Europe
Asia Pacific
Others
Consumer Telephone Products
Electronic Learning Products
Contract Manufacturing Services &
Multimedia Communications Products
Other Businesses
FY2001: US$1,334.9M
Consumer Telephone Products
Sales (US$’M)
FY2001: US$823.8M
Electronic Learning Products
Sales (US$’M)
FY2001: US$291.2M
Turnover by Product Line (US$’M)
823.8
(61.7%)
291.2
(21.8%)
208.2
(15.6%)
11.7 (0.9%)
FY2001: US$1,334.9M
1047.2
(78.5%)
181.6
(13.6%) 51.0
(3.8%)
55.1 (4.1%)
764.5
(92.8%)
35.1 (4.3%)
22.5 (2.7%)
1.7 (0.2%)
139.8 (48.0%)
126.2
(43.3%)
11.1 (3.8%)
14.1 (4.9%)
0
10
20
30
50
70
40
60
US$'M
-20
-15
-10
-5
5
%
15
0
10
R & D Expenditure EBITDA/Sales (%)
EBIT/Sales (%)
27.6
30.1
40.3
42.7
66.6
97 98 99 00 01 97
10.2
98
12.5
99
12.5
00
7.8
01
7.4 9.4 9.1
4.4
-15.0
-11.7
VTech Holdings Ltd Annual Report 2001