Vtech 2001 Annual Report Download - page 4
Download and view the complete annual report
Please find page 4 of the 2001 Vtech annual report below. You can navigate through the pages in the report by either clicking on the pages listed below, or by using the keyword search tool below to find specific information within the annual report.-
 1
1 -
 2
2 -
 3
3 -
 4
4 -
 5
5 -
 6
6 -
 7
7 -
 8
8 -
 9
9 -
 10
10 -
 11
11 -
 12
12 -
 13
13 -
 14
14 -
 15
15 -
16
-
17
-
18
-
19
-
20
-
21
-
22
-
23
-
24
-
25
-
26
-
27
-
28
-
29
-
30
-
31
-
32
-
33
-
34
-
35
-
36
-
37
-
38
-
39
-
40
-
41
-
42
-
43
-
44
-
45
-
46
-
47
-
48
-
49
-
50
-
51
-
52
-
53
-
54
-
55
-
56
-
57
-
58
-
59
-
60
-
61
-
62
-
63
-
64
-
65
-
66
-
67
-
68
-
69
-
70
-
71
-
72
 |
 |

2
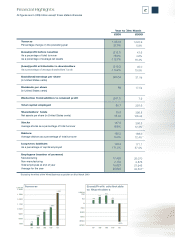
Turnover
Percentage change on the preceding year
(Loss)/profit before taxation
As a pecentage of total turnover
As a pecentage of average net assets
(Loss)/profit attributable to shareholders
As a percentage of average shareholders’ funds
Basic(loss)/earnings per share
(in United States cents)
Dividends per share
(in United States cents)
(Reduction from)/addition to retained profit
Total capital employed
Shareholders’ funds
Net assets per share (in United States cents)
Stocks
Average stocks as a percentage of total turnover
Debtors
Average debtors as a percentage of total turnover
Long-term liabilities
As a percentage of capital employed
Employees (number of persons)
Manufacturing
Non-manufacturing
Total employees at end of year
Average for the year
1,334.9
27.6%
(213.1)
-16.0%
-112.7%
(215.0)
-114.2%
(96.7)¢
Nil
(241.1)
80.7
79.8
35.4¢
187.5
16.6%
195.3
14.4%
138.2
171.3%
17,493
2,134
19,627
25,622
1,045.9
8.9%
47.6
4.6%
16.4%
45.0
15.5%
21.0¢
17.5¢
7.9
297.6
296.8
138.4¢
256.8
12.3%
188.0
12.4%
171.1
57.5%
25,070
2,876
27,946
24,507
2
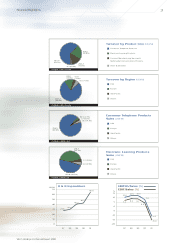
Financial Highlights
97 98 99 00 01
731
842
961
1,046
1,335
700
800
900
1,000
1,200
1,300
1,400
US$'M Turnover
97 98 99 00 01
44
69
83
45
(215)
(150)
(200)
(250)
(100)
(50)
0
50
100
US$'M
(Loss)/Profit attributable
to Shareholders
1,100
Year to 31st March
All figures are in US$ million except those stated otherwise
*Excluding the effect of the Wired Business acquisition on 31st March 2000
2001 2000
*
*
*