Vodafone 2006 Annual Report Download - page 37
Download and view the complete annual report
Please find page 37 of the 2006 Vodafone annual report below. You can navigate through the pages in the report by either clicking on the pages listed below, or by using the keyword search tool below to find specific information within the annual report.-
 1
1 -
2
-
3
-
4
-
5
-
6
-
7
-
8
-
9
-
10
-
11
-
12
-
13
-
14
-
15
-
16
-
17
-
18
-
19
-
20
-
21
-
22
-
23
-
24
-
25
-
26
-
 27
27 -
 28
28 -
 29
29 -
 30
30 -
 31
31 -
 32
32 -
 33
33 -
 34
34 -
 35
35 -
 36
36 -
 37
37 -
 38
38 -
 39
39 -
 40
40 -
 41
41 -
 42
42 -
 43
43 -
 44
44 -
 45
45 -
 46
46 -
 47
47 -
48
-
49
-
50
-
51
-
52
-
53
-
54
-
55
-
56
-
57
-
58
-
59
-
60
-
61
-
62
-
63
-
64
-
65
-
66
-
67
-
68
-
69
-
70
-
71
-
72
-
73
-
74
-
75
-
76
-
77
-
78
-
79
-
80
-
81
-
82
-
83
-
84
-
85
-
86
-
87
-
88
-
89
-
90
-
91
-
92
-
93
-
94
-
95
-
96
-
97
-
98
-
99
-
100
-
101
-
102
-
103
-
104
-
105
-
106
-
107
-
108
-
109
-
110
-
111
-
112
-
113
-
114
-
115
-
116
-
117
-
118
-
119
-
120
-
121
-
122
-
123
-
124
-
125
-
126
-
127
-
128
-
129
-
130
-
131
-
132
-
133
-
134
-
135
-
136
-
137
-
138
-
139
-
140
-
141
-
142
-
143
-
144
-
145
-
146
-
147
-
148
-
149
-
150
-
151
-
152
 |
 |

Vodafone Group Plc Annual Report 2006 35
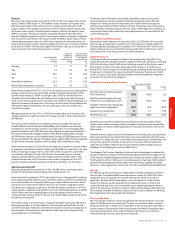
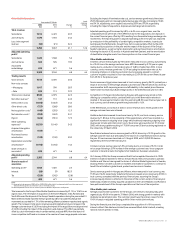
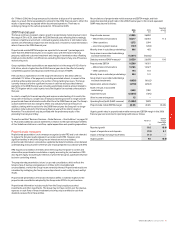
Other Mobile Operations
Local
Years ended 31 March currency
2006 2005 Change change
£m £m % %
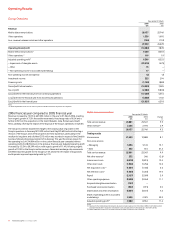
Total revenue
Subsidiaries 7,812 6,474 20.7
Joint ventures 1,470 1,184 24.2
Less: intra-segment
revenue (32) (21) 52.4
9,250 7,637 21.1 12.6
Adjusted operating
profit(2)
Subsidiaries 1,445 1,368 5.6
Joint ventures 363 305 19.0
Associated
undertakings 695 671 3.6
2,503 2,344 6.8 6.4
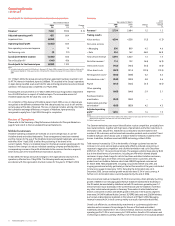
Trading results
Voice services 7,313 6,070 20.5
Non-voice services
– Messaging 1,017 790 28.7
– Data 200 113 77.0
Total service revenue 8,530 6,973 22.3
Net other revenue(1) 137 110 24.5
Interconnect costs (1,698) (1,367) 24.2
Other direct costs (727) (568) 28.0
Net acquisition costs(1) (443) (393) 12.7
Net retention costs(1) (358) (267) 34.1
Payroll (624) (531) 17.5
Other operating
expenses(2) (1,531) (1,140) 34.3
Acquired intangibles
amortisation (157) –
Purchased licence
amortisation (129) (100) 29.0
Depreciation and other
amortisation(2) (1,192) (1,044) 14.2
Share of result in
associates(2) 695 671 3.6
Adjusted operating
profit(2) 2,503 2,344 6.8 6.4
Share in result of
associates
Operating profit(2) 1,044 1,020 2.4
Interest (20) (7) 185.7
Tax (329) (342) (3.8)
695 671 3.6
Notes:
(1) Revenue includes revenue of £583 million (2005: £554 million) which has been excluded from other revenue and
deducted from acquisition and retention costs in the trading results.
(2) Before impairment losses and non-recurring amounts related to acquisitions and disposals.
Total revenue for the Group’s Other Mobile Operations increased by 21.1%, or 12.6% on an
organic basis. The net impact of acquisitions in the Czech Republic, India, Romania and
South Africa and the disposal of the Group’s Swedish operations during the year ended 31
March 2006 increased reported revenue growth by 6.8%. Favourable exchange rate
movements accounted for 1.7% of the remaining difference between reported and organic
growth. The increase in total service revenue was principally driven by an increase in the
average customer base of 26.5% excluding the impact of the acquisitions and disposal and
of 44.0% including the impact of the acquisitions and disposal. This effect was partially
offset by cuts in termination rates in certain markets, reduced ARPU from the launch of
more competitive tariffs and an increase in the number of lower usage prepaid customers.
Excluding the impact of termination rate cuts, service revenue growth would have been
25.0%. Messaging and non-messaging data revenue grew strongly, increasing by 18.6%
and 74.1%, respectively, on an organic basis and by 28.7% and 77.0%, respectively,
including the impact of acquisitions, disposals and exchange rate movements.
Adjusted operating profit increased by 6.8%, or 6.4% on an organic basis, over the
comparative period, with 0.5% of the difference due to the acquisitions and disposal in
the current financial year, offset by 0.9% resulting from favourable foreign exchange rate
movements. The reported growth in adjusted operating profit in the year was impacted
by a reduction in the profitability of certain highly competitive markets, in particular
Australia and the Netherlands, though these factors were partially offset by the profit
contributed by acquisitions in the year and the impact of the disposal of the Group’s
Swedish operations, as well as higher depreciation and purchased licence amortisation,
following the launch of 3G services in Australia and New Zealand, and the amortisation
of identifiable intangible assets from the acquisitions in the current financial year.
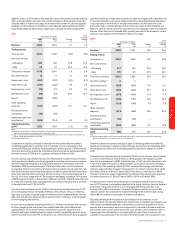
Other Mobile subsidiaries
In Greece, service revenue grew by 9.4% when measured in local currency, due primarily
to a 13.6% rise in the average customer base. ARPU decreased by 3.7% year-on-year,
mainly due to a reduction in termination rates of 16.8% in September 2004. In local
currency, service revenue growth was 12.0% excluding the termination rate cut. An
increasing emphasis on retaining customers by encouraging prepaid to contract
customer migration resulted in churn decreasing to 25.0% for the current financial year
from 29.7% in the previous year.
Service revenue in Egypt, when measured in local currency, grew by 36.2%, primarily as a
result of an increase in the average prepaid customer base of 82.0% which was driven by
new innovative tariffs improving access and affordability in the market place. Revenue
market share increased by 3.8 percentage points in the 2006 financial year to 51.8%.
Competition in Portugal intensified during the year with aggressively priced no-frills
offerings by competitors which, combined with cuts in the termination rate which
resulted in the average termination rate this year being 28.3% lower than last year, led to
local currency service revenue growth being restricted to 1.6%.
In the Netherlands, an increase of 3.5% in service revenue and a 10.0% growth in the
average customer base was achieved.
Vodafone Australia increased its customer base by 16.0%, and local currency service
revenue by 11.8% due to the popularity of the capped plans, which have resulted in a
significant increase in outgoing voice usage, whilst adversely impacting outgoing voice
revenue per minute and interconnect costs. 3G services were launched on 31 October
2005, with strong uptake resulting in 171,000 consumer 3G devices being registered on
the network by 31 March 2006.
New Zealand achieved service revenue growth of 8.5%, driven by a 12.3% growth in the
average customer base, due principally to the launch of competitive promotions during
the year. 3G services were launched on 10 August 2005, with 103,000 3G devices
registered by the end of the financial year.
In Ireland, service revenue grew by 5.9%, primarily due to an increase of 9.2% in total
voice usage following a 5.9% increase in the average customer base. Voice usage per
customer in Ireland remains the highest of all Vodafone’s European subsidiaries.
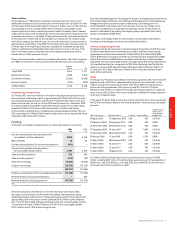
On 5 January 2006, the Group announced that it had completed the sale of its 100%
interest in Vodafone Sweden to Telenor, the pan-Nordic telecommunications operator.
Vodafone and Telenor have agreed the terms of a Partner Market Agreement in Sweden,
allowing Telenor’s mobile customers in Sweden and Vodafone customers to continue to
benefit from Vodafone’s global brand, products and services in Sweden.
Service revenue growth in Hungary and Albania, when measured in local currency, was
13.9% and 16.2% respectively. Vodafone Romania increased service revenue by 39.0% in
local currency compared with the previous financial year, assuming the Group’s
increased equity interest is reflected in the whole of the current and prior financial year.
Additionally, Vodafone’s newly acquired subsidiaries in the Czech Republic and Romania
have performed ahead of the Group’s expectations at the time of the acquisition.
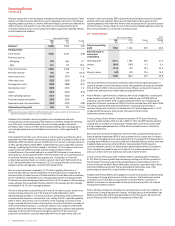
Other Mobile joint ventures
Average proportionate customers for the Group’s joint ventures, excluding Italy, grew
organically by 43.4% in the year to 31 March 2006, with strong growth in markets with
relatively low penetration rates. The customer growth was the primary reason for the
19.0% increase in adjusted operating profit for other mobile joint ventures.
During the financial year, the Group completed the acquisition of a 10% economic
interest in Bharti Tele-Ventures Limited (now renamed Bharti Airtel Limited), a leading
national mobile operator in India.
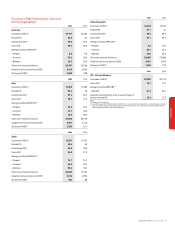
Performance