Vodafone 2000 Annual Report Download - page 64
Download and view the complete annual report
Please find page 64 of the 2000 Vodafone annual report below. You can navigate through the pages in the report by either clicking on the pages listed below, or by using the keyword search tool below to find specific information within the annual report.-
 1
1 -
2
-
3
-
4
-
5
-
6
-
7
-
8
-
9
-
10
-
11
-
12
-
13
-
14
-
15
-
16
-
17
-
18
-
19
-
20
-
21
-
22
-
23
-
24
-
25
-
26
-
27
-
28
-
29
-
30
-
31
-
32
-
33
-
34
-
35
-
36
-
37
-
38
-
39
-
40
-
41
-
42
-
43
-
44
-
45
-
46
-
47
-
48
-
49
-
50
-
51
-
52
-
53
-
 54
54 -
 55
55 -
 56
56 -
 57
57 -
 58
58 -
 59
59 -
 60
60 -
 61
61 -
 62
62 -
 63
63 -
 64
64 -
 65
65 -
 66
66 -
 67
67 -
 68
68
 |
 |

Vodafone AirTouch Plc Annual Report & Accounts for the year ended 31 March 2000
62
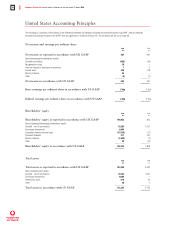
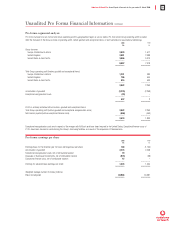
Summary of differences between UK and US GAAP pro forma financial information
The pro forma financial information has been prepared in accordance with UK generally accepted accounting principles (“UK GAAP”). A description of the
relevant accounting principles which differ materially from US GAAP is provided on page 59. The effects of these differing accounting principles on the
pro forma profit and loss accounts presented for the years ended 31 March 2000 and 31 March 1999 are summarised below.
2000 1999
£m £m
UK GAAP pro forma net income/(loss) 104 (1,106)
Items (decreasing)/increasing net income/(loss):
Goodwill amortisation (534) (535)
Reorganisation costs 25 –
Profit on disposal of fixed asset investments 14
Income taxes 625 637
Minority interests 46 45
Other (9) 4
–––––––– ––––––––
Pro forma net income/(loss) in accordance with US GAAP 258 (951)
–––––––– ––––––––
US GAAP pro forma basic earnings/(loss) per ordinary share 0.83p (3.13)p
Pro forma proportionate information
The following tables of pro forma customer and financial information are presented on a proportionate basis. Proportionate presentation is not required by
UK GAAP and is not intended to replace the consolidated financial statements prepared in accordance with UK GAAP. However, since significant entities in
which the Group has an interest are not consolidated, proportionate information is provided as supplemental data to facilitate a more detailed
understanding and assessment of the consolidated financial statements prepared in accordance with UK GAAP.
UK GAAP requires consolidation of entities controlled by the Group and the equity method of accounting for entities in which the Group has significant
influence but not a controlling interest. Joint ventures are consolidated using the gross equity method. Proportionate presentation is a pro rata
consolidation, which reflects the Group’s share of turnover and expenses in both its consolidated and unconsolidated entities. Proportionate results are
calculated by multiplying the Group’s ownership interest in each entity by each entity’s results.
Proportionate information includes results from the Group’s equity accounted investments and investments held at cost. The Group does not have control
over the turnover, expenses or cash flow of these investments and is only entitled to cash from dividends received from these entities. The Group does
not own the underlying assets of these investments.
As a condition to the European Commission’s approval of the merger with AirTouch Communications, Inc. the Group entered into an undertaking to
dispose of its interest in E-Plus Mobilfunk GmbH following merger completion. As a result, pro forma proportionate customer and financial information
excludes E-Plus for the years presented.
2000 1999
Proportionate customer information (thousands) Number Number
Proportionate number of customers
Europe, Middle East & Africa 15,662 9,170
United Kingdom 8,791 5,575
United States & Asia Pacific 14,686 10,676
–––––––– ––––––––
39,139 25,421
–––––––– ––––––––
2000 1999
Proportionate financial information £m £m
Proportionate turnover
Europe, Middle East & Africa 4,437 3,208
United Kingdom 2,945 2,170
United States & Asia Pacific 5,187 3,807
–––––––– ––––––––
12,569 9,185
–––––––– ––––––––
Proportionate EBITDA*
Europe, Middle East & Africa 1,492 1,127
United Kingdom 934 816
United States & Asia Pacific 1,522 1,103
–––––––– ––––––––
3,948 3,046
Less: Depreciation and amortisation, excluding goodwill (1,240) (991)
–––––––– ––––––––
Proportionate total Group operating profit before goodwill and exceptional costs 2,708 2,055
–––––––– ––––––––
* Proportionate EBITDA (earnings before interest, tax, depreciation and amortisation) is defined as operating profit before exceptional reorganisation costs plus depreciation and amortisation
of subsidiary undertakings, joint ventures, associated undertakings and investments, proportionate to equity stakes. Proportionate EBITDA represents the Group’s ownership interests in the
respective entities’ EBITDA. As such, proportionate EBITDA does not represent EBITDA available to the Group.
Unaudited Pro forma Financial Information continued