Vectren 2011 Annual Report Download - page 3
Download and view the complete annual report
Please find page 3 of the 2011 Vectren annual report below. You can navigate through the pages in the report by either clicking on the pages listed below, or by using the keyword search tool below to find specific information within the annual report.-
 1
1 -
 2
2 -
 3
3 -
 4
4 -
 5
5 -
 6
6 -
 7
7 -
 8
8 -
 9
9 -
 10
10 -
 11
11 -
 12
12 -
 13
13 -
 14
14 -
15
-
16
-
17
-
18
-
19
-
20
-
21
-
22
-
23
-
24
-
25
-
26
-
27
-
28
-
29
-
30
-
31
-
32
-
33
-
34
-
35
-
36
-
37
-
38
-
39
-
40
-
41
-
42
-
43
-
44
-
45
-
46
-
47
-
48
-
49
-
50
-
51
-
52
-
53
-
54
-
55
-
56
-
57
-
58
-
59
-
60
-
61
-
62
-
63
-
64
-
65
-
66
-
67
-
68
-
69
-
70
-
71
-
72
-
73
-
74
-
75
-
76
-
77
-
78
-
79
-
80
-
81
-
82
-
83
-
84
-
85
-
86
-
87
-
88
-
89
-
90
-
91
-
92
-
93
-
94
-
95
-
96
-
97
-
98
-
99
-
100
-
101
-
102
-
103
-
104
-
105
-
106
-
107
-
108
-
109
-
110
-
111
-
112
-
113
-
114
-
115
-
116
-
117
-
118
-
119
-
120
-
121
-
122
-
123
-
124
-
125
-
126
-
127
-
128
-
129
-
130
-
131
-
132
 |
 |

Carl L. Chapman
Chairman, President
and CEO
Focused. On our customers. On our communities. On the execution of our strategy to
meet and often exceed expectations of multiple stakeholders. This focus led to a solid
2011 that not only delivered strong financial performance but also witnessed significant
wins from the initiatives of our new strategic plan that was put in motion in 2011.
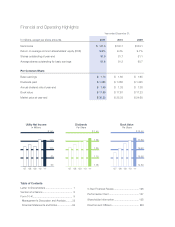
2011 Financial Results
Reported net income was $141.6 million, or $1.73 per share, compared to 2010
results of $133.7 million or, $1.65 per share. Vectren’s utility earnings were again the
driver of company performance with earnings of $122.9 million, compared to $123.9
million in 2010. The results of our three natural gas utilities were aided by a continued
rebound of large customer usage. The summer of 2011 helped spur electric utility
performance with temperatures that were warmer than normal, but it did not match
the heat from summer 2010. However, new electric base rates were approved by the
Indiana Utility Regulatory Commission in late April 2011 and put into effect in May,
which helped support electric results.
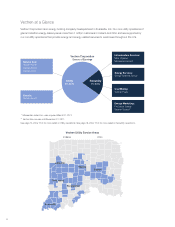
In 2011, Vectren’s nonutility earnings climbed year-over-year ending at $23.8 million,
compared to $9.8 million in 2010. Our nonutility businesses of Energy Systems Group,
Vectren Fuels, Miller Pipeline and our newly acquired business, Minnesota Limited,
combined for $38.2 million of earnings in 2011, compared to $21.4 million the prior
year. As expected, ProLiance Energy (ProLiance) operated at a loss, ending the year
with a ($22.9) million loss compared to a loss of ($7.9) million in 2010. Results from the
other nonutility businesses, which include legacy real estate and other investments,
were a loss of ($10.2) million reflecting carrying value adjustments. However, the
December sale of Vectren Source, our residential and commercial gas marketing
venture, helped improve nonutility earnings. Proceeds from the sale were $84.3
million, inclusive of and subject to a final determination of working capital, and were
used to pay down short-term debt. The sale resulted in an approximate $12.4 million
consolidated gain after consideration of all associated tax impacts.
Letter to Shareholders
1
2011 Annual Report.indd 3 3/2/2012 3:21:27 PM