Vectren 2010 Annual Report Download - page 2
Download and view the complete annual report
Please find page 2 of the 2010 Vectren annual report below. You can navigate through the pages in the report by either clicking on the pages listed below, or by using the keyword search tool below to find specific information within the annual report.-
 1
1 -
 2
2 -
 3
3 -
 4
4 -
 5
5 -
 6
6 -
 7
7 -
 8
8 -
 9
9 -
 10
10 -
 11
11 -
 12
12 -
 13
13 -
14
-
15
-
16
-
17
-
18
-
19
-
20
-
21
-
22
-
23
-
24
-
25
-
26
-
27
-
28
-
29
-
30
-
31
-
32
-
33
-
34
-
35
-
36
-
37
-
38
-
39
-
40
-
41
-
42
-
43
-
44
-
45
-
46
-
47
-
48
-
49
-
50
-
51
-
52
-
53
-
54
-
55
-
56
-
57
-
58
-
59
-
60
-
61
-
62
-
63
-
64
-
65
-
66
-
67
-
68
-
69
-
70
-
71
-
72
-
73
-
74
-
75
-
76
-
77
-
78
-
79
-
80
-
81
-
82
-
83
-
84
-
85
-
86
-
87
-
88
-
89
-
90
-
91
-
92
-
93
-
94
-
95
-
96
-
97
-
98
-
99
-
100
-
101
-
102
-
103
-
104
-
105
-
106
-
107
-
108
-
109
-
110
-
111
-
112
-
113
-
114
-
115
-
116
-
117
-
118
-
119
-
120
-
121
-
122
-
123
-
124
-
125
-
126
-
127
-
128
 |
 |

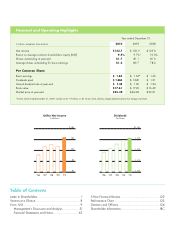
Table of Contents
Letter to Shareholders .................................................1
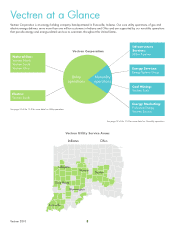
Vectren at a Glance .................................................. 8
Form 10-K ................................................................ 9
Management’s Discussion and Analysis ................. 31
Financial Statements and Notes ............................ 63
5-Year Financial Review ............................................122
Performance Chart ...................................................123
Directors and Officers ...............................................124
Shareholder Information ............................................ IBC
Financial and Operating Highlights
Year ended December 31,
In millions, except per share amounts 2010 2009 2008
Net income $ 133.7 $ 133.1* $ 129.0
Return on average common shareholders’ equity (ROE) 9.4% 9.7%* 10.0%
Shares outstanding at year-end 81.7 81.1 81.0
Average shares outstanding for basic earnings 81.2 80.7 78.3
Per Common Share
Basic earnings $ 1.65 $ 1.65* $ 1.65
Dividends paid $ 1.365 $ 1.345 $ 1.31
Annual dividend rate at year-end $ 1.38 $ 1.36 $ 1.34
Book value $ 17.61 $ 17.23 $ 16.69
Market price at year-end $ 25.38 $ 24.68 $ 25.01
*Twelve months ended December 31, 2009, includes an $11.9 million, or $0.15 per share, after-tax charge related to Liberty Gas Storage investment.
$1.45
1.35
1.25
1.15
1.05
Dividends
Per Share
‘06 ‘07 ‘08 ‘09 ‘10
$140
120
100
80
60
Utility Net Income
In Millions
‘06 ‘07 ‘08 ‘09 ‘10