Valero 2006 Annual Report Download - page 12
Download and view the complete annual report
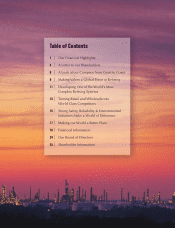
Please find page 12 of the 2006 Valero annual report below. You can navigate through the pages in the report by either clicking on the pages listed below, or by using the keyword search tool below to find specific information within the annual report.-
 1
1 -
 2
2 -
 3
3 -
 4
4 -
 5
5 -
 6
6 -
 7
7 -
 8
8 -
 9
9 -
 10
10 -
 11
11 -
 12
12 -
 13
13 -
 14
14 -
 15
15 -
 16
16 -
 17
17 -
 18
18 -
 19
19 -
 20
20 -
 21
21 -
 22
22 -
23
-
24
-
25
-
26
-
27
-
28
 |
 |

45
40
35
30
25
20
Number of Heavy, Sour Crudes
& Resids Used by Valero
2002 2003 2004 2005 2006
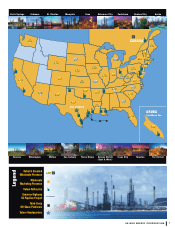
North America
50%
Middle
East
17%
Africa
12%
South
America
11%
Europe 7%
Rest of World 3%
Source of Valero’s 2006
Feedstock Consumption
Th e num b er o f dif fere n t he a vy, sou r and res i d
fe e dsto c ks t hat Val e ro p r oces ses h as g r own
fr o m 27 to 4 0 in just five year s.
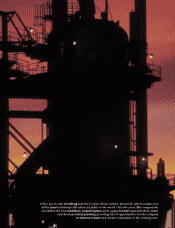
Oil tankers, like this one shown at the Port Arthur refinery’s dock, deliver crude
oil from around the world to the company’s plants. Because of the complexity and
flexibility of its system, Valero is able to choose from a wide selection of feedstocks,
giving it an earnings advantage over many of its peers.
Flexibility and Diversity Key to Valero’s
Feedstock Strategy