Unum 2007 Annual Report Download - page 2
Download and view the complete annual report
Please find page 2 of the 2007 Unum annual report below. You can navigate through the pages in the report by either clicking on the pages listed below, or by using the keyword search tool below to find specific information within the annual report.-
 1
1 -
 2
2 -
 3
3 -
 4
4 -
 5
5 -
 6
6 -
 7
7 -
 8
8 -
 9
9 -
 10
10 -
 11
11 -
 12
12 -
 13
13 -
14
-
15
-
16
-
17
-
18
-
19
-
20
-
21
-
22
-
23
-
24
-
25
-
26
-
27
-
28
-
29
-
30
-
31
-
32
-
33
-
34
-
35
-
36
-
37
-
38
-
39
-
40
-
41
-
42
-
43
-
44
-
45
-
46
-
47
-
48
-
49
-
50
-
51
-
52
-
53
-
54
-
55
-
56
-
57
-
58
-
59
-
60
-
61
-
62
-
63
-
64
-
65
-
66
-
67
-
68
-
69
-
70
-
71
-
72
-
73
-
74
-
75
-
76
-
77
-
78
-
79
-
80
-
81
-
82
-
83
-
84
-
85
-
86
-
87
-
88
-
89
-
90
-
91
-
92
-
93
-
94
-
95
-
96
-
97
-
98
-
99
-
100
-
101
-
102
-
103
-
104
-
105
-
106
-
107
-
108
-
109
-
110
-
111
-
112
-
113
-
114
-
115
-
116
-
117
-
118
-
119
-
120
-
121
-
122
-
123
-
124
-
125
-
126
-
127
-
128
-
129
-
130
-
131
-
132
-
133
-
134
-
135
-
136
-
137
-
138
-
139
-
140
-
141
-
142
-
143
-
144
-
145
-
146
-
147
-
148
 |
 |

4 Letter from the CEO
7 Financial Strength for the Future
8 Future Ready
10 Unum US
12 Unum UK
14 Colonial Life
16 Board of Directors and Senior Officers
17 Financial Review
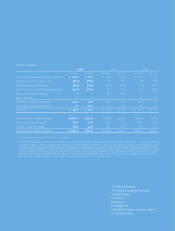
FINANCIAL HIGHLIGHTS
2007 2006 2005
(in millions) per share* (in millions) per share* (in millions) per share*
Income from Continuing Operations, As Adjusted** $ 786.2 $ 2.21 $ 603.3 $ 1.80 $ 513.1 $ 1.64
Net Realized Investment Gain (Loss) (43.2) (0.12) 1.5 0.01 (4.3) (0.02)
Regulatory Reassessment Charges (34.5) (0.10) (267.4) (0.79) (51.6) (0.16)
Special Tax Items and Debt Extinguishment Costs (36.1) (0.10) 78.9 0.23 42.8 0.14
Broker Compensation Settlements — — (12.7) (0.04) — —
Gain on Disposition — — — — 4.0 0.01
Income from Continuing Operations 672.4 1.89 403.6 1.21 504.0 1.61
Income from Discontinued Operations 6.9 0.02 7.4 0.02 9.6 0.03
Net Income $ 679.3 $ 1.91 $ 411.0 $ 1.23 $ 513.6 $ 1.64
Total Stockholders’ Equity (Book Value) $8,039.9 $22.28 $7,718.8 $22.53 $7,363.9 $24.66
Net Unrealized Gain on Securities 356.1 0.99 534.8 1.56 1,040.7 3.49
Net Gain on Cash Flow Hedges 182.5 0.50 194.2 0.57 273.3 0.91
Total Stockholders’ Equity, As Adjusted** $7,501.3 $20.79 $6,989.8 $20.40 $6,049.9 $20.26
* Per Share Amounts for Operating Statement Data Assume Dilution.
** We analyze our performance using non-GAAP financial measures which exclude certain items and the related tax thereon from net income. We believe “Income from Continuing
Operations, As Adjusted,” which is a non-GAAP financial measure and excludes realized investment gains and losses, which are recurring, and certain other items as specified,
is a better performance measure and a better indicator of the profitability and underlying trends in our business. Realized investment gains and losses are primarily dependent
on market conditions and general economic events and are not necessarily related to decisions regarding our underlying business. The exclusion of certain other items specified
above also enhances the understanding and comparability of our performance and the underlying fundamentals in our operations, but this exclusion is not an indication that
similar items may not recur. We also believe that book value per common share excluding unrealized gains and losses on securities and the net gain or loss on cash flow hedges,
which also tend to fluctuate depending on market conditions and general economic trends, is an important measure.