Union Pacific 2010 Annual Report Download - page 7
Download and view the complete annual report
Please find page 7 of the 2010 Union Pacific annual report below. You can navigate through the pages in the report by either clicking on the pages listed below, or by using the keyword search tool below to find specific information within the annual report.-
 1
1 -
 2
2 -
 3
3 -
 4
4 -
 5
5 -
 6
6 -
 7
7 -
 8
8 -
 9
9 -
 10
10 -
 11
11 -
 12
12 -
 13
13 -
 14
14 -
 15
15 -
 16
16 -
 17
17 -
 18
18 -
19
-
20
-
21
-
22
-
23
-
24
-
25
-
26
-
27
-
28
-
29
-
30
-
31
-
32
-
33
-
34
-
35
-
36
-
37
-
38
-
39
-
40
-
41
-
42
-
43
-
44
-
45
-
46
-
47
-
48
-
49
-
50
-
51
-
52
-
53
-
54
-
55
-
56
-
57
-
58
-
59
-
60
-
61
-
62
-
63
-
64
-
65
-
66
-
67
-
68
-
69
-
70
-
71
-
72
-
73
-
74
-
75
-
76
-
77
-
78
-
79
-
80
-
81
-
82
-
83
-
84
-
85
-
86
-
87
-
88
-
89
-
90
-
91
-
92
-
93
-
94
-
95
-
96
-
97
-
98
-
99
-
100
-
101
 |
 |
7
the Gulf Coast region, as well as the West and Canada, bound for major agricultural users in the Midwest
and the western U.S.
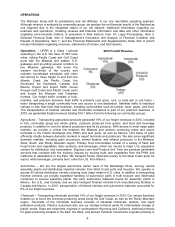
Energy – Coal transportation accounted for 22% of our 2010 freight revenues. Our transportation network
allows us to transport coal and coke to utilities, industrial facilities, interchange points, and water
terminals. Water terminals provide access to the West and Gulf Coasts for export, and rail/barge
interchange facilities on the Mississippi and Ohio Rivers and the Great Lakes. We serve mines located in
the Southern Powder River Basin (SPRB) of Wyoming, Colorado, Utah, southern Wyoming, and southern
Illinois. SPRB coal represents the largest segment of the market, as utilities continue to favor its lower
cost and low-sulfur content.
Industrial Products – Our extensive network enables us to move numerous commodities between
thousands of origin and destination points throughout North America. Lumber shipments originate
primarily in the PNW and Canada for destinations throughout the U.S. for new home construction and
repair and remodeling. Commercial and highway construction drives shipments of steel and construction
products, consisting of rock, cement, and roofing materials. Paper and consumer goods, as well as
furniture and appliances, are shipped to major metropolitan areas for consumers. Nonferrous metals and
industrial minerals are moved for industrial manufacturing. In addition, we provide efficient and safe
transportation for government entities and waste companies. In 2010, transporting industrial products
provided 16% of our freight revenues.
Intermodal – Our intermodal business, which represented 20% of our freight revenues in 2010, includes
international and domestic shipments. International business consists of imported or exported container
traffic that arrives at, or departs from, West Coast ports via ocean vessel. Domestic business includes
domestic container and trailer traffic for major retailers and other U.S. businesses that is usually sold
through intermodal marketing companies (primarily shipper agents and consolidators) and truckload
carriers.
Seasonality – Some of the commodities we carry have peak shipping seasons, reflecting either or both
the nature of the commodity, such as certain agricultural and food products that have specific growing
and harvesting seasons, and the demand cycle for the commodity, such as intermodal traffic, which
generally has a peak shipping season during the third quarter to meet holiday-related demand for
consumer goods during the fourth quarter. The peak shipping seasons for these commodities can vary
considerably from year to year depending upon various factors, including the strength of domestic and
international economies and currencies and the strength of harvests and market prices of agricultural
products. In response to an annual request delivered by the Surface Transportation Board (STB) of the
U.S. Department of Transportation (DOT) to all of the Class I railroads operating in the U.S., we issue a
publicly available letter during the third quarter detailing our plans for handling traffic during the third and
fourth quarters and providing other information requested by the STB.
Working Capital – At December 31, 2010 and 2009, we had a working capital surplus, which in 2010
continued to be the result of our decision in 2009 to maintain additional cash reserves to enhance liquidity
in response to uncertain economic conditions. Historically, we have had a working capital deficit, which is
common in our industry and does not indicate a lack of liquidity. We maintain adequate resources and,
when necessary, have access to capital to meet any daily and short-term cash requirements, and we
have sufficient financial capacity to satisfy our current liabilities.
Competition – We are subject to competition from other railroads, motor carriers, ship and barge
operators, and pipelines. Our main rail competitor is Burlington Northern Santa Fe Corporation. Its rail
subsidiary, BNSF Railway Company (BNSF), operates parallel routes in many of our main traffic
corridors. In addition, we operate in corridors served by other railroads and motor carriers. Motor carrier
competition exists for five of our six commodity groups (excluding energy). Because of the proximity of
our routes to major inland and Gulf Coast waterways, barges can be particularly competitive, especially
for grain and bulk commodities. In addition to price competition, we face competition with respect to
transit times and quality and reliability of service. While we must build or acquire and maintain our rail
system, trucks and barges are able to use public rights-of-way maintained by public entities. Any future
improvements or expenditures materially increasing the quality or reducing the costs of these alternative
modes of transportation, or legislation releasing motor carriers from their size or weight limitations, could
have a material adverse effect on our business.