Ubisoft 2005 Annual Report Download - page 11
Download and view the complete annual report
Please find page 11 of the 2005 Ubisoft annual report below. You can navigate through the pages in the report by either clicking on the pages listed below, or by using the keyword search tool below to find specific information within the annual report.-
 1
1 -
 2
2 -
 3
3 -
 4
4 -
 5
5 -
 6
6 -
 7
7 -
 8
8 -
 9
9 -
 10
10 -
 11
11 -
 12
12 -
 13
13 -
 14
14 -
 15
15 -
 16
16 -
 17
17 -
 18
18 -
 19
19 -
 20
20 -
 21
21 -
 22
22 -
23
-
24
-
25
-
26
-
27
-
28
-
29
-
30
-
31
-
32
-
33
-
34
-
35
-
36
-
37
-
38
-
39
-
40
-
41
-
42
-
43
-
44
-
45
-
46
-
47
-
48
-
49
-
50
-
51
-
52
-
53
-
54
-
55
-
56
-
57
-
58
-
59
-
60
-
61
-
62
-
63
-
64
-
65
-
66
-
67
-
68
-
69
-
70
-
71
-
72
-
73
-
74
-
75
-
76
-
77
-
78
-
79
-
80
-
81
-
82
-
83
-
84
-
85
-
86
-
87
-
88
-
89
-
90
-
91
-
92
-
93
-
94
-
95
-
96
-
97
-
98
-
99
-
100
-
101
-
102
-
103
-
104
-
105
-
106
-
107
-
108
-
109
-
110
-
111
-
112
-
113
-
114
-
115
-
116
-
117
-
118
-
119
-
120
-
121
-
122
-
123
-
124
-
125
-
126
-
127
-
128
-
129
-
130
-
131
-
132
-
133
-
134
-
135
-
136
-
137
-
138
-
139
-
140
-
141
-
142
-
143
-
144
-
145
-
146
-
147
-
148
-
149
-
150
-
151
-
152
-
153
-
154
-
155
-
156
-
157
-
158
-
159
-
160
-
161
-
162
-
163
 |
 |

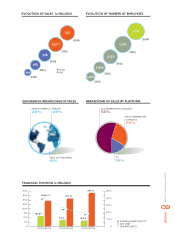
EVOLUTION OF NUMBER OF EMPLOYEES
EVOLUTION OF SALES (€ MILLION)
BREAKDOWN OF SALES BY PLATFORM
GEOGRAPHIC BREAKDOWN OF SALES
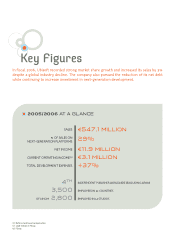
09
UBISOFT • 2006 ANNUAL REPORT
GROUP
FINANCIAL POSITION (€ MILLION)
0
50
31/03/2004 31/03/2005 31/03/2006
118.6(3)
293.7(3)
74.4
41
24
17
317.6
381.3
65.3
100
150
200
250
300
350
400 50%
40%
30%
20%
10%
0
SHAREHOLDER’S EQUITY
NET DEBT
GEARING RATIO
2006
547
2005
533
(2)
2004
508
2003
453
2002
369
2006
3,441
2005
2,972
2004
2,352
2003
1,990
2002
1,901
EUROPE
49%
REST OF THE WORLD
6%
NORTH AMERICA
45%
OLD GENERATION CONSOLES
55%
NEXT-GENERATION
CONSOLES
29%
PC
16%
FGaap
IFRS