Travelzoo 2013 Annual Report Download - page 21
Download and view the complete annual report
Please find page 21 of the 2013 Travelzoo annual report below. You can navigate through the pages in the report by either clicking on the pages listed below, or by using the keyword search tool below to find specific information within the annual report.-
 1
1 -
2
-
3
-
4
-
5
-
6
-
7
-
8
-
9
-
10
-
 11
11 -
 12
12 -
 13
13 -
 14
14 -
 15
15 -
 16
16 -
 17
17 -
 18
18 -
 19
19 -
 20
20 -
 21
21 -
 22
22 -
 23
23 -
 24
24 -
 25
25 -
 26
26 -
 27
27 -
 28
28 -
 29
29 -
 30
30 -
 31
31 -
32
-
33
-
34
-
35
-
36
-
37
-
38
-
39
-
40
-
41
-
42
-
43
-
44
-
45
-
46
-
47
-
48
-
49
-
50
-
51
-
52
-
53
-
54
-
55
-
56
-
57
-
58
-
59
-
60
-
61
-
62
-
63
-
64
-
65
-
66
-
67
-
68
-
69
-
70
-
71
-
72
-
73
-
74
-
75
-
76
-
77
-
78
-
79
-
80
-
81
-
82
-
83
-
84
-
85
-
86
-
87
-
88
-
89
-
90
-
91
-
92
-
93
-
94
-
95
-
96
-
97
-
98
-
99
-
100
-
101
-
102
-
103
-
104
-
105
-
106
-
107
-
108
-
109
-
110
-
111
-
112
-
113
-
114
-
115
-
116
-
117
-
118
-
119
-
120
 |
 |

19
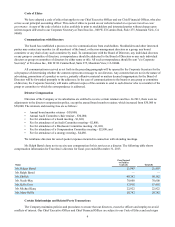
Summary Compensation Table
The following summary compensation table sets forth information concerning the compensation to our Chief
Executive Officer, Chief Financial Officer and the three other most highly compensated executive officers during the fiscal
years ended December 31, 2013, 2012 and 2011.
Name and Principal
Position Fiscal
Year Salary
($) Bonus
($)
Option
Awards
($)(1)
Non-Equity
Incentive Plan
Compensation
($)(2)
All Other
Compensation
($) Total
($)
Christopher Loughlin (3)
2013 562,000 60,000 (7) 1,415,250 184,364 (12) 24,429 (17) 2,246,043
Chief Executive Officer
2012 562,000 17,500 (7) — — (12) 46,327 (17) 625,827
2011 556,500 43,500 (7) — 40,000 (12) 46,555 (17) 686,555
Glen Ceremony (4)
2013 450,000 88,889 (8) — 116,178 (13) 3,903 (18) 658,970
Chief Financial Officer
(effective June 15,
2011) 2012 450,000 50,000 (8) 953,800 87,500 (13) 1,500 (18) 1,542,800
2011 245,455 25,000 (8) 150,000 (13) 1,500 (18) 421,955
Shirley Tafoya
2013 542,000 30,000 (9) — 443,561 (14) 4,173 (19) 1,019,734
President, North America
2012 542,000 110,000 (9) 953,800 80,000 (14) 3,869 (19) 1,689,669
2011 536,500 120,000 (9) — 270,000 (14) 1,500 (19) 928,000
Richard Singer (5)
2013 311,573 9,099 (10) — 291,295 (15) 24,168 (20) 636,135
Managing Director,
Europe (effective July 1,
2012) 2012 267,688 32,918 (10) — 49,374 (15) 10,341 (20) 360,321
Mark K. Webb (6)
2013 437,500 60,000 (11) — 107,053 (16) — 604,553
President, Local Deals
(effective February 27,
2012) 2012 324,800 67,473 (11) — 47,473 (16) — 439,746
Notes:
(1) Under SEC rules, the values reported reflect the aggregate grant date fair value of grants of stock options to each of the
listed officers in the years shown. We calculate the grant date fair value of stock options using the Black-Scholes option
pricing model. For a more detailed discussion on the valuation model and assumptions used to calculate the fair value of
our options, refer to Note 9 to the consolidated financial statements contained in our 2013Annual Report on Form 10-K
filed on February 12, 2014.
(2) The amounts reflected in this column reflect the performance-based cash awards paid to the named executives pursuant to
certain employment agreements, as discussed in the CD&A above.
(3) Mr. Loughlin became the Chief Executive Officer on July 1, 2010.
(4) Mr. Ceremony became the Chief Financial Officer on June 15, 2011.
(5) Mr. Singer became Commercial Director, Europe on January 16, 2012 and become Managing Director, Europe on July 1,
2012. Mr. Singer's compensation is denominated in British pounds and was translated into U.S. dollars using the annual
average daily exchange rate of £1 = $1.56 for 2013 and £1 = $1.58 for 2012.