Toshiba 2005 Annual Report Download - page 3
Download and view the complete annual report
Please find page 3 of the 2005 Toshiba annual report below. You can navigate through the pages in the report by either clicking on the pages listed below, or by using the keyword search tool below to find specific information within the annual report.-
 1
1 -
 2
2 -
 3
3 -
 4
4 -
 5
5 -
 6
6 -
 7
7 -
 8
8 -
 9
9 -
 10
10 -
 11
11 -
 12
12 -
 13
13 -
 14
14 -
15
-
16
-
17
-
18
-
19
-
20
-
21
-
22
-
23
-
24
-
25
-
26
-
27
-
28
-
29
-
30
-
31
-
32
-
33
-
34
-
35
-
36
-
37
-
38
-
39
-
40
-
41
-
42
-
43
-
44
-
45
-
46
-
47
-
48
-
49
-
50
-
51
-
52
-
53
-
54
-
55
-
56
-
57
-
58
-
59
-
60
-
61
-
62
-
63
-
64
-
65
-
66
-
67
-
68
-
69
-
70
-
71
-
72
-
73
-
74
-
75
-
76
-
77
-
78
-
79
-
80
-
81
-
82
 |
 |

130th Anniversary Toshiba Corporation 1
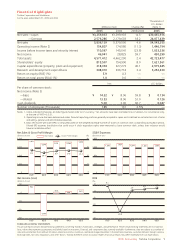
Financial Highlights
Toshiba Corporation and Subsidiaries
For the years ended March 31, 2005 and 2004
Thousands of
U.S. dollars
Millions of yen Change (%) (Note 1)
2005 2004 2005/2004 2005
Net sales—Japan ¥3,259,853 ¥3,399,903 (4.1) $30,465,916
—Overseas 2,576,286 2,179,603 18.2 24,077,439
Net sales 5,836,139 5,579,506 4.6 54,543,355
Operating income (Note 2) 154,807 174,586 (11.3) 1,446,794
Income before income taxes and minority interest 110,567 145,041 (23.8) 1,033,336
Net income 46,041 28,825 59.7 430,290
Total assets 4,571,412 4,462,200 2.4 42,723,477
Shareholders‘ equity 815,507 754,990 8.0 7,621,561
Capital expenditures (property, plant and equipment) 318,394 227,273 40.1 2,975,645
Research and development expenditures 348,010 336,714 3.4 3,252,430
Return on equity (ROE) (%) 5.9 4.3 — —
Return on total assets (ROA) (%) 1.0 0.6 — —
Yen U.S. dollars
Per share of common stock:
Net income (Note 3)
—basic ¥ 14.32 ¥ 8.96 59.8 $ 0.134
—diluted 13.53 8.96 51.0 0.126
Cash dividends 5.00 3.00 66.7 0.047
Number of employees (Thousands) 165 161 2.5% —
Notes: 1. Unless indicated otherwise, all dollar figures herein refer to U.S.currency. Yen amounts have been translated into U.S.dollars, for convenience only,
at the rate of ¥107=U.S.$1.
2. Operating income has been determined under financial reporting practices generally accepted in Japan and is defined as net sales less cost of sales
and selling, general and administrative expenses.
3. Basic net income per share (EPS) is computed based on the weighted-average number of shares of common stock outstanding during each period.
Diluted EPS assumes the dilution that could occur if stock acquisition rights were exercised to issue common stock, unless their inclusion would
have an antidilutive effect.
01/3 02/3 03/3 04/3 05/3 01/3 02/3 03/3 04/3 05/3
01/3 02/3 03/3 04/3 05/3
6,000
4,500
3,000
1,500
0
40
30
20
10
0
1,600
1,200
800
400
0
10
0
-10
-20
-30
-40
(%)
01/3 02/3 03/3 04/3 05/3
100
0
-100
-200
-300
5,951
96.2
27.4
24.5
26.7 27.0 26.4
5,349
-254.0
5,656
18.5
5,580
28.8
5,836
46.0
1,396
9.1
-29.0
2.9 4.3 5.9
1,437 1,394 1,330 1,385
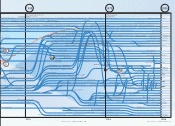
Net Sales & Gross Profit Margin
(Billions of yen) Net Sales Gross Profit Margin (Billions of yen)
Net Income (Loss)
(Billions of yen) (%)
SG&A Expenses
ROE
FORWARD-LOOKING STATEMENTS
This annual report contains forward-looking statements concerning Toshiba’s future plans, strategies, and performance. These forward-looking statements are not historical
facts, rather they represent assumptions and beliefs based on economic, financial, and competitive data currently available. Furthermore, they are subject to a number of
risks and uncertainties that, without limitation, relate to economic conditions, worldwide megacompetition in the electronics business, customer demand, foreign currency
exchange rates, tax rules, regulations, and other factors. Toshiba therefore wishes to caution readers that actual results may differ materially from our expectations.