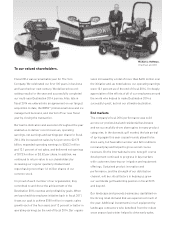
Toro 2014 Annual Report Download - page 6
Download and view the complete annual report
Please find page 6 of the 2014 Toro annual report below. You can navigate through the pages in the report by either clicking on the pages listed below, or by using the keyword search tool below to find specific information within the annual report.-
 1
1 -
 2
2 -
 3
3 -
 4
4 -
 5
5 -
 6
6 -
 7
7 -
 8
8 -
 9
9 -
 10
10 -
 11
11 -
 12
12 -
 13
13 -
 14
14 -
 15
15 -
 16
16 -
 17
17 -
18
-
19
-
20
-
21
-
22
-
23
-
24
-
25
-
26
-
27
-
28
-
29
-
30
-
31
-
32
-
33
-
34
-
35
-
36
-
37
-
38
-
39
-
40
-
41
-
42
-
43
-
44
-
45
-
46
-
47
-
48
-
49
-
50
-
51
-
52
-
53
-
54
-
55
-
56
-
57
-
58
-
59
-
60
-
61
-
62
-
63
-
64
-
65
-
66
-
67
-
68
-
69
-
70
-
71
-
72
-
73
-
74
-
75
-
76
-
77
-
78
-
79
-
80
-
81
-
82
-
83
-
84
-
85
-
86
 |
 |

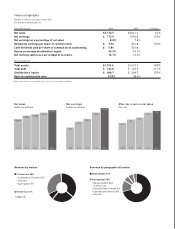
Net sales
Do
llars in millions
1,690.4
1,884.01,958.7
2,041.4
2,172.7
F’14F’10F’11F’12F’13
Net earnings
Do
llars in millions
93.2
117.7
129.5
154.8
F’10F’11F’12F’13
154.8
F’13F’13
173.9
F’14
After-tax return on net sales
Percent
5.5
6.2
6.6
7.6
F’10F’11F’12F’13
8.0
F’14
Professional 68%
Residential 31%
Other 1%
Landscape & Grounds 36%
Golf 25%
Ag Irrigation 7%
Revenue by market
United States 71%
International 29%
Revenue by geographical location
Europe, Middle East
& Africa 13%
Australia/New Zealand 6%
Canada/Latin America 6%
Asia 4%
Financial highlights
(Dollars in millions, except per share data)
Fiscal years ended October 31
For the fiscal year 2014 2013 % Change
Net sales $ 2,172.7 $2,041.4 6.4%
Net earnings $ 173.9 $154.8 12.3%
Net earnings as a percentage of net sales 8.0% 7.6%
Diluted net earnings per share of common stock $ 3.02 $2.62 15.3%
Cash dividends paid per share of common stock outstanding $ 0.80 $0.56
Return on average stockholders’ equity 45.3% 46.1%
Net working capital as a percentage of net sales* 15.1% 16.6%
At fiscal year end
Total assets $1,192.4 $1,002.7 18.9%
Total debt $ 374.8 $ 223.5 67.7%
Stockholders’ equity $ 408.7 $ 358.7 13.9%
Debt-to-capitalization ratio 47.8% 38.4%
*Defined as average receivables plus inventory, less trade payables.