Toro 2007 Annual Report Download - page 2
Download and view the complete annual report
Please find page 2 of the 2007 Toro annual report below. You can navigate through the pages in the report by either clicking on the pages listed below, or by using the keyword search tool below to find specific information within the annual report.-
 1
1 -
 2
2 -
 3
3 -
 4
4 -
 5
5 -
 6
6 -
 7
7 -
 8
8 -
 9
9 -
 10
10 -
 11
11 -
 12
12 -
 13
13 -
14
-
15
-
16
-
17
-
18
-
19
-
20
-
21
-
22
-
23
-
24
-
25
-
26
-
27
-
28
-
29
-
30
-
31
-
32
-
33
-
34
-
35
-
36
-
37
-
38
-
39
-
40
-
41
-
42
-
43
-
44
-
45
-
46
-
47
-
48
-
49
-
50
-
51
-
52
-
53
-
54
-
55
-
56
-
57
-
58
-
59
-
60
-
61
-
62
-
63
-
64
-
65
-
66
-
67
-
68
-
69
-
70
-
71
-
72
-
73
-
74
-
75
-
76
-
77
-
78
-
79
-
80
-
81
-
82
-
83
-
84
-
85
-
86
 |
 |

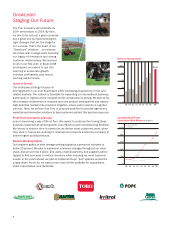
Financial Highlights
(Dollars in thousands, except per share data) Fiscal years ended October 31 2007 2006 % Change
For the Fiscal Year
Net sales $1,876,904 $1,835,991 2.2%
Net earnings 142,436 129,145 10.3
Net earnings as a percentage of net sales 7.6% 7.0%
Diluted net earnings per share of common stock $ 3.40 $ 2.91 16.8
Cash dividends paid per share of common stock outstanding 0.48 0.36 33.3
Return on average stockholders’ equity 37.4% 33.0%
At Fiscal Year End
Net working capital1$ 443,424 $ 443,704 –
Total assets 950,837 919,073 3.5%
Total debt 229,581 175,320 30.9
Stockholders’ equity 370,438 392,029 (5.5)
Debt-to-capitalization ratio 38.3% 30.9%
1Defined as average receivables plus inventory, less trade payables
The Toro Company (NYSE: TTC) is a leading worldwide provider of
outdoor maintenance equipment and precision irrigation systems.
Since 1914, a passion for building turf expertise and driving innovation has
resulted in products and services to help our customers care for golf courses,
sports fields, residential lawns, public grounds and agricultural fields. •We
are headquartered in Bloomington, Minnesota, with manufacturing, engineer-
ing, sales and test facilities around the globe. •Our brands are sold and
supported by a network of worldwide distributors, dealers, and home center
retailers. •With just over two-thirds of our revenue from professional markets,
Toro’s strong portfolio is well-positioned for the future.
0
400
800
1,200
1,600
$2,000
07
$1,876.9
0605040302010099
Net Sales
(Dollars in millions)
0
30
60
90
120
$150
07
$142.4
0605040302010099
Earnings Before Accounting Change
(Dollars in millions)
0
2
4
6
8%
07
7.6%
0605040302010099
After-Tax Return on Net Sales
Before Accounting Change