TiVo 2003 Annual Report Download - page 17
Download and view the complete annual report
Please find page 17 of the 2003 TiVo annual report below. You can navigate through the pages in the report by either clicking on the pages listed below, or by using the keyword search tool below to find specific information within the annual report.
Table of Contents
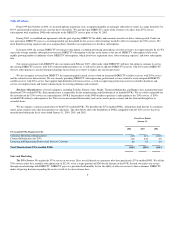
ITEM 6. SELECTED FINANCIAL DATA
The following selected financial data as of and for the fiscal years ended January 31, 2004, 2003, and 2002, respectively, have been derived from our
consolidated financial statements audited by KPMG LLP, independent auditors. Additionally, the following selected financial data as of and for the one-
month transition period ended January 31, 2001 and calendar years ended December 31, 2000 and 1999 have been derived from our consolidated financial
statements audited by Arthur Andersen LLP, independent auditors. These historical results are not necessarily indicative of the results of operations to be
expected for any future period.
The data set forth below (in thousands, except per share data) should be read in conjunction with Item 7. "Management's Discussion and Analysis of
Financial Condition and Results of Operations" and the consolidated financial statements included in Item 8. "Financial Statements and Supplementary Data."
Year Ended
Year Ended
Year Ended
One-Month
Ended
Year Ended
Year Ended
January 31,
2004
January 31,
2003
January 31,
2002
January 31,
2001
December 31,
2000
December 31,
1999
(in thousands, except per share data)
Consolidated Statement of Operations Data:
Revenues
Service revenues $ 61,560 $ 39,261 $ 19,297 $ 989 $ 3,782 $ 223
Technology revenues 15,797 20,909 100 — — —
Hardware revenues 72,882 45,620 — — — —
Rebates, revenue share, and other payments to the channel (9,159) (9,780) — (630) (5,029) (667)
Net Revenues 141,080 96,010 19,397 359 (1,247) (444)
Costs and expenses
Cost of service revenues 17,705 17,119 19,852 1,719 18,734 4,183
Cost of technology revenues 13,609 8,033 62 — — —
Cost of hardware revenues 74,836 44,647 — — — —
Research and development 22,167 20,714 27,205 2,544 25,070 10,158
Sales and marketing 18,947 48,117 104,897 13,946 151,658 39,183
General and administrative 16,296 14,465 18,875 1,395 15,537 7,834
Other operating expense, net — — — — — 7,210
Loss from operations (22,480) (57,085) (151,494) (19,245) (212,246) (69,012)
Interest income 498 4,483 2,163 672 7,928 2,913
Interest expense and other (9,587) (27,569) (7,374) (17) (522) (466)
Loss before income taxes (31,569) (80,171) (156,705) (18,590) (204,840) (66,565)
Provision for income taxes (449) (425) (1,000) — — —
Net loss (32,018) (80,596) (157,705) (18,590) (204,840) (66,565)
Less: Series A redeemable convertible preferred stock dividend — (220) (3,018) (423) (1,514) —
Less: Accretion to redemption value of Series A redeemable convertible preferred
stock — (1,445) — — — —
Net loss attributable to common stockholders $ (32,018) $ (82,261) $(160,723) $ (19,013) $ (206,354) $ (66,565)
Net loss per share
Basic and diluted $ (0.48) $ (1.61) $ (3.74) $ (0.47) $ (5.55) $ (5.49)
Weighted average shares used to calculate basic and diluted net loss per share 66,784 51,219 42,956 40,850 37,175 12,129
16


