Texas Instruments 2006 Annual Report Download - page 8
Download and view the complete annual report
Please find page 8 of the 2006 Texas Instruments annual report below. You can navigate through the pages in the report by either clicking on the pages listed below, or by using the keyword search tool below to find specific information within the annual report.-
 1
1 -
 2
2 -
 3
3 -
 4
4 -
 5
5 -
 6
6 -
 7
7 -
 8
8 -
 9
9 -
 10
10 -
 11
11 -
 12
12 -
 13
13 -
 14
14 -
 15
15 -
 16
16 -
 17
17 -
 18
18 -
 19
19 -
20
-
21
-
22
-
23
-
24
-
25
-
26
-
27
-
28
-
29
-
30
-
31
-
32
-
33
-
34
-
35
-
36
-
37
-
38
-
39
-
40
-
41
-
42
-
43
-
44
-
45
-
46
-
47
-
48
-
49
-
50
-
51
-
52
-
53
-
54
-
55
-
56
-
57
-
58
-
59
-
60
-
61
-
62
-
63
-
64
 |
 |

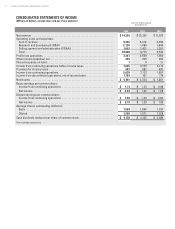
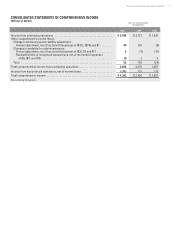
CONSOLIDATED STATEMENTS OF INCOME
(Millions of dollars, except share and per-share amounts)
TEXAS INSTRUMENTS 2006 ANNUAL REPORT
6
FOR THE YEARS ENDED
DECEMBER 31,
2006 2005 2004
Net revenue .............................................................. $14,255 $ 12,335 $ 11,552
Operating costs and expenses:
Cost of revenue ......................................................... 6,996 6,319 6,295
Research and development (R&D) ........................................ 2,195 1,986 1,946
Selling, general and administrative (SG&A) ................................ 1,697 1,471 1,351
Total ................................................................... 10,888 9,776 9,592
Profit from operations ..................................................... 3,367 2,559 1,960
Other income (expense) net ................................................ 265 205 233
Interest expense on loans .................................................. 7921
Income from continuing operations before income taxes ...................... 3,625 2,755 2,172
Provision for income taxes ................................................. 987 582 481
Income from continuing operations ......................................... 2,638 2,173 1,691
Income from discontinued operations, net of income taxes .................... 1,703 151 170
Net income ............................................................... $4,341 $2,324 $1,861
Basic earnings per common share:
Income from continuing operations ....................................... $1.73 $ 1.33 $ 0.98
Net income ............................................................. $2.84 $ 1.42 $ 1.08
Diluted earnings per common share:
Income from continuing operations ....................................... $1.69 $ 1.30 $ 0.96
Net income ............................................................. $2.78 $ 1.39 $ 1.05
Average shares outstanding (millions):
Basic .................................................................. 1,528 1,640 1,730
Diluted ................................................................. 1,560 1,671 1,768
Cash dividends declared per share of common stock .......................... $0.130 $0.105 $0.089
See accompanying notes.