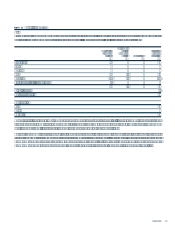
Tesco 2004 Annual Report Download - page 59
Download and view the complete annual report
Please find page 59 of the 2004 Tesco annual report below. You can navigate through the pages in the report by either clicking on the pages listed below, or by using the keyword search tool below to find specific information within the annual report.-
 1
1 -
2
-
3
-
4
-
5
-
6
-
7
-
8
-
9
-
10
-
11
-
12
-
13
-
14
-
15
-
16
-
17
-
18
-
19
-
20
-
21
-
22
-
23
-
24
-
25
-
26
-
27
-
28
-
29
-
30
-
31
-
32
-
33
-
34
-
35
-
36
-
37
-
38
-
39
-
40
-
41
-
42
-
43
-
44
-
45
-
46
-
47
-
48
-
 49
49 -
 50
50 -
 51
51 -
 52
52 -
 53
53 -
 54
54 -
 55
55 -
 56
56 -
 57
57 -
 58
58 -
 59
59 -
 60
60
 |
 |

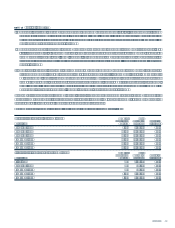
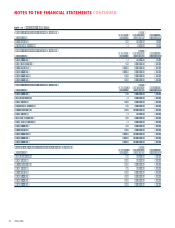
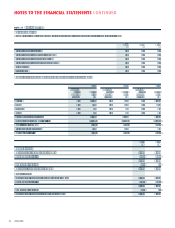
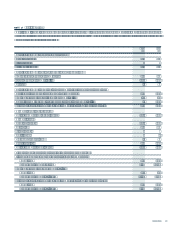
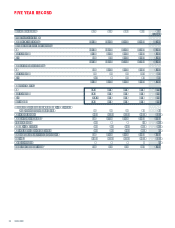
TESCO PLC 57
Year ended February 2000 2001 2002 2003 2004
53 weeks
Group enterprise value 513,591 21,590 21,290 16,896 23,866
Underlying diluted earnings per share 3/4 10.18p 10.66p 12.14p 13.98p 16.31p
Underlying earnings per share 3/4 10.36p 10.87p 12.33p 14.10p 16.45p
Dividend per share 4.48p 4.98p 5.60p 6.20p 6.84p
Return on shareholders funds 4/6 20.9% 22.7% 23.2% 23.3% 23.6%
Return on capital employed 4/7 11.3% 11.0% 10.8% 10.2% 10.5%
Group statistics
Number of stores 845 907 979 2,291 2,318
Total sales area 000 sq ft 24,039 28,362 32,491 39,944 45,402
Full-time equivalent employees 134,896 152,210 171,794 188,182 223,335
UK retail statistics
Number of stores 659 692 729 1,982 1,878
Total sales area 000 sq ft 816,895 17,965 18,822 21,829 23,291
Average store size (sales area sq ft) 926,641 27,636 28,576 29,455 30,890
Full-time equivalent employees 10 108,409 113,998 121,272 133,051 152,408
UK retail productivity £
Turnover per employee (restated) 11 155,042 159,678 163,443 160,157 162,459
Profit per employee 11 9,160 9,649 10,002 9,748 10,013
Wages per employee 11 15,600 16,087 16,821 17,020 17,615
Weekly sales per sq ft (restated) 8/12 21.27 21.75 22.43 22.86 22.48
1Sales and turnover have been restated
in accordance with FRS 5, Application
Note G Revenue Recognition (issued
November 2003) to report sales and
turnover net of vouchers and on a
commission-only basis for mobile phone
airtime sales.
2Excludes integration costs and goodwill
amortisation. Operating margin is based
upon turnover exclusive of VAT.
3Underlying profit, underlying earnings
per share and underlying diluted earnings
per share exclude net loss on disposal
of fixed assets, integration costs and
goodwill amortisation.
42004, 2003, 2002 and 2001 statistics have
been calculated based on the adoption
of FRS 19 Deferred Tax.
5Market capitalisation plus net debt.
6Underlying profit divided by average
shareholders funds.
7Revised post-tax ROCE measure.
The numerator is profit before
interest, less tax.The denominator
is the calculated average of net
intangibles plus net tangible fixed assets
plus net investments in joint ventures
and associates plus net working
capital and long-term provisions.
8Store sizes exclude lobby and
restaurant areas.
9Average store size excludes
Express and T&S stores.
10 Based on average number of full-
time equivalent employees in the UK.
11 Based on turnover exclusive of VAT,
underlying operating profit and total
staff cost per full-time equivalent
employee.
12 Based on weighted average sales
area and sales excluding property
development.
Designed and produced by Corporate Edge 020 7855 5888 Photography by Arnhel de Serra Printed by CTD Printers Ltd
This material is recyclable, bio-degradable and is approved recycled grade.
This product complies with ISO 9002 and ISO 14001 Accreditation.
D