Tesco 2004 Annual Report Download - page 5
Download and view the complete annual report
Please find page 5 of the 2004 Tesco annual report below. You can navigate through the pages in the report by either clicking on the pages listed below, or by using the keyword search tool below to find specific information within the annual report.-
 1
1 -
 2
2 -
 3
3 -
 4
4 -
 5
5 -
 6
6 -
 7
7 -
 8
8 -
 9
9 -
 10
10 -
 11
11 -
 12
12 -
 13
13 -
 14
14 -
 15
15 -
 16
16 -
17
-
18
-
19
-
20
-
21
-
22
-
23
-
24
-
25
-
26
-
27
-
28
-
29
-
30
-
31
-
32
-
33
-
34
-
35
-
36
-
37
-
38
-
39
-
40
-
41
-
42
-
43
-
44
-
45
-
46
-
47
-
48
-
49
-
50
-
51
-
52
-
53
-
54
-
55
-
56
-
57
-
58
-
59
-
60
 |
 |

TESCO PLC 3
The Group continued to generate strong operating
cash flows. Net cash inflow from operating activities
increased by 23.9% to £2,942m (2003 – £2,375m).
Working capital improvements contributed £0.5bn
to cash flow this year, and whilst £50m is due to
the 53rd week, the rest is due to growth in the
business and management focus.
Group net debt in the year decreased by £647m
to £4,090m (2003 – £4,737m). Gearing decreased
to 51% (2003 – 73%).
Post-tax return on capital employed increased to
10.5% from 10.2% last year.
GROUP INTEREST AND TAXATION Net interest payable
was £223m (2003 – £180m). Interest cover is
now 8.2 times compared to 8.6 times last year.
Ta x has been charged at an effective rate of
31.1% (2003 – 30.5%). Prior to accounting for the
net loss on disposal of fixed assets, integration
costs and goodwill amortisation, our underlying tax
rate was 29.5% (2003 – 29.6%).
SHAREHOLDER RETURNS AND DIVIDENDS Underlying
diluted earnings per share (excluding net loss on
disposal of fixed assets, integration costs and
goodwill amortisation) increased by 16.7% to
16.31p (2003 – 13.98p).
The Board has proposed a final dividend of 4.77p
(2003 – 4.33p) giving a total dividend for the year
of 6.84p (2003 – 6.20p).This represents an increase
of 10.3% in line with our policy of strong dividend
growth while continuing to build cover.
Total recognised gains and losses in the year were
£943m (2003 – £968m), comprising profit for the
year of £1,100m and losses on foreign currency
translation of £157m.
Group shareholders’ funds, before minority
interests, increased by £1,429m. This was due to
retained profits of £584m, new shares issued less
expenses of £1,002m and losses on foreign
currency translation of £157m. As a result, return
on shareholders’ funds was 23.6%.
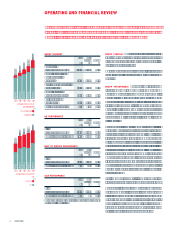
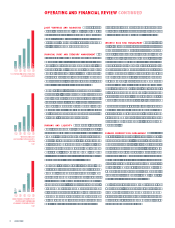
Total shareholder return, which is measured as the
percentage change in the share price plus the
dividend, has been 66.1% over the last five years,
compared to the FTSE 100 average of (16.5)%.
Over the last three years it has been 3.4%,
compared to the FTSE 100 average of (17.1)%.
In the last year, total shareholder return in Tesco
was 58.6% compared to the FTSE 100 average
of 25.2%.
UK Sales grew by 16.3% to £26,876m (2003 –
£23,101m as restated). On a 52-week basis, UK sales
grew by 14.2% to £26,381m. Of this, 6.7% came
from existing stores and 7.5% from net new stores.
Underlying operating profit in the UK was 17.7%
higher at £1,526m (2003 – £1,297m) and operating
margin increased to 6.2%.
The tesco.com operations achieved sales of
£577m (2003 – £447m) and excluding USA and
South Korea start-up losses, made a profit of
£28m (2003 – £12m).
As part of our store development programme we
opened 64 new stores comprising eight Extras,
20 Superstores, four Metro, 30 Express and two
T&S Stores. Including extensions and refits, we
opened an additional 1.8m sq ft of new space
and expect to open a further 1.4m sq ft in the
coming year.
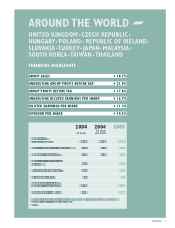
INTERNATIONAL Sales are up 29%, with strong
volume growth. Profits have grown strongly by 44%,
and operating margins have increased from 4.5%
last year to 5.1%.
REST OF EUROPE In the Rest of Europe sales rose
by 27.5% to £3,834m (2003 – £3,007m as
restated) and contributed an underlying operating
profit of £184m, up from £141m last year.
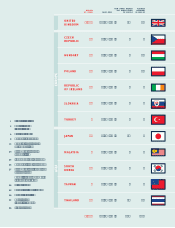
Sales in the Republic of Ireland, at constant
exchange rates, grew by 10%. We have 82 stores,
giving us 1.9m sq ft and have plans for a further
eight stores next year.
In Central Europe we opened 22 hypermarkets
in the year giving us 110 in total.
ASIA In the year, our Asian businesses had sales
of £2,847m (2003 – £2,172m as restated), up
31.1% on the previous year and made an underlying
operating profit of £122m (2003 – £71m).
In Asia, we opened 22 stores in the year, giving
us 179 in total.
1 year 3 years 5 years
TOTAL SHAREHOLDER RETURN
RELATIVE TO THE FTSE 100
82.6
82.6
20.5
20.5
33.4
33.4
00 01 0302
UK SALES GROWTH %
(restated)
7.7
8.8
8.4
7.3
4.0
4.0
04
16.3 14.2
6.7
6.7
6.0
6.0
4.7
4.7
4.1
4.1
TOTAL
LIKE-FOR-LIKE
53rd WEEK
00 01 0302
UK SALES AREA OPENED
000 sq ft
1,433
1,433
04
1,778
1,296
1,296
1,298
1,298
1,216
1,216