Telstra 2013 Annual Report Download - page 14
Download and view the complete annual report
Please find page 14 of the 2013 Telstra annual report below. You can navigate through the pages in the report by either clicking on the pages listed below, or by using the keyword search tool below to find specific information within the annual report.-
 1
1 -
2
-
3
-
 4
4 -
 5
5 -
 6
6 -
 7
7 -
 8
8 -
 9
9 -
 10
10 -
 11
11 -
 12
12 -
 13
13 -
 14
14 -
 15
15 -
 16
16 -
 17
17 -
 18
18 -
 19
19 -
 20
20 -
 21
21 -
 22
22 -
 23
23 -
 24
24 -
25
-
26
-
27
-
28
-
29
-
30
-
31
-
32
-
33
-
34
-
35
-
36
-
37
-
38
-
39
-
40
-
41
-
42
-
43
-
44
-
45
-
46
-
47
-
48
-
49
-
50
-
51
-
52
-
53
-
54
-
55
-
56
-
57
-
58
-
59
-
60
-
61
-
62
-
63
-
64
-
65
-
66
-
67
-
68
-
69
-
70
-
71
-
72
-
73
-
74
-
75
-
76
-
77
-
78
-
79
-
80
-
81
-
82
-
83
-
84
-
85
-
86
-
87
-
88
-
89
-
90
-
91
-
92
-
93
-
94
-
95
-
96
-
97
-
98
-
99
-
100
-
101
-
102
-
103
-
104
-
105
-
106
-
107
-
108
-
109
-
110
-
111
-
112
-
113
-
114
-
115
-
116
-
117
-
118
-
119
-
120
-
121
-
122
-
123
-
124
-
125
-
126
-
127
-
128
-
129
-
130
-
131
-
132
-
133
-
134
-
135
-
136
-
137
-
138
-
139
-
140
-
141
-
142
-
143
-
144
-
145
-
146
-
147
-
148
-
149
-
150
-
151
-
152
-
153
-
154
-
155
-
156
-
157
-
158
-
159
-
160
-
161
-
162
-
163
-
164
-
165
-
166
-
167
-
168
-
169
-
170
-
171
-
172
-
173
-
174
-
175
-
176
-
177
-
178
-
179
-
180
-
181
-
182
-
183
-
184
-
185
-
186
-
187
-
188
-
189
-
190
-
191
-
192
-
193
-
194
-
195
-
196
-
197
-
198
-
199
-
200
-
201
-
202
-
203
-
204
-
205
-
206
-
207
-
208
 |
 |

FULL YEAR RESULTS
AND OPERATIONS REVIEW
REPORTED RESULTS
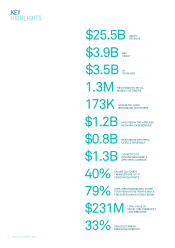
In financial year 2013 sales revenue
increased by 1.1 per cent or $270 million
to $25,502 million and total income
increased by 1.9 per cent or $477 million
to $25,980 million.
Operating expenses (before depreciation
and amortisation) increased by
0.5 per cent or $81 million to
$15,350 million.
Labour expenses decreased by 3.3 per
cent to $4,803 million driven by lower
labour substitution and other labour
expenses. Excluding TelstraClear from
both periods, labour expenses declined
by 2.0 per cent.
With our growing customer base and
increased handset sales, directly variable
costs (DVCs) or goods and services
purchased increased by 3.4 per cent
to $6,389 million. Network payments
expense continued to decline.
Other expenses increased by 0.8 per cent
to $4,158 million driven by an increase
in service contract expense to support
operational initiatives, and the loss
recognised on the sale of TelstraClear.
This was offset by an overall decrease
in impairment expenses.
Earnings before interest, tax,
depreciation and amortisation
(EBITDA) increased by 3.9 per cent
to $10,629 million. EBITDA margins
increased by 1.1 percentage points to
41.7 per cent. Earnings before interest
and tax (EBIT) increased by 9.8 per cent
to $6,391 million.
Net finance costs increased by
2.4 per cent to $909 million as a result
of revaluation impacts offset to a large
extent by net borrowing costs decreasing
from lower market interest rates.
Reported profit after tax increased by
12.9 per cent to $3,865 million. Basic
earnings per share (EPS) increased
by 11.6 per cent from 27.5 cents to
30.7 cents.
<h[[YWi^Óeme\+"&(*c_bb_edmWi
generated in the year. Accrued capital
expenditure was $3,792 million or
14.9 per cent of sales.
On 8 August 2013, the Directors of Telstra
resolved to pay a fully franked final
dividend of 14 cents per share bringing
the total dividend to 28 cents per share
for the 2013 financial year. Shares
will trade excluding entitlement to the
dividend on 19 August 2013 with payment
on 20 September 2013.
SUMMARY FINANCIAL RESULTS
FY13
$m
FY12
$m
Change
%
Sales revenue 25,502 25,232 1.1
Total income 25,980 25,503 1.9
Operating expenses 15,350 15,269 0.5
EBITDA 10,629 10,234 3.9
Depreciation
and amortisation 4,238 4,412 (3.9)
EBIT 6,391 5,822 9.8
Net finance costs 909 888 2.4
Tax 1,617 1,510 7.1
Net profit after tax 3,865 3,424 12.9
Attributable net profit 3,813 3,405 12.0
Accrued capex(1) 3,792 3,591 5.6
<h[[YWi^Óem 5,024 5,197 (3.3)
Earnings per share
(cents) 30.7 27.5 11.6
Dividend payout ratio (%) 91 102 n/m
(1) Accrued capital expenditure is defined as additions to property,
equipment and intangible assets, including capital lease additions,
measured on an accrued basis.
RESULTS ON A GUIDANCE BASIS*
FY13 FY13 guidance
Total income 3.3% Low single digit growth
EBITDA 4.8% Low single digit growth
Capex/sales 14.9% Around 15%
<h[[YWi^Óem $5.2 billion $4.75-$5.25 billion
Dividend 28c fully franked 28c fully franked
GUIDANCE VERSUS REPORTED RESULTS*
FY13 FY13 FY13 FY12
Reported
results
$m
Adjustments
$m
Guidance
basis
$m
Guidance
basis
$m
Total
income 25,980 (164) 25,816 25,001
EBITDA 10,629 127 10,756 10,264
Free
YWi^Óem 5,024 152 5,176 n/m
*Adjusted for TelstraClear trading results and sale and spectrum payments.
Please refer to the guidance versus reported results reconciliation on
page 203. This reconciliation forms part of the Full Year Results and
Operations Review, and has been reviewed by our auditors.
12 Telstra Annual Report 2013