Telstra 2008 Annual Report Download - page 13
Download and view the complete annual report
Please find page 13 of the 2008 Telstra annual report below. You can navigate through the pages in the report by either clicking on the pages listed below, or by using the keyword search tool below to find specific information within the annual report.-
 1
1 -
2
-
 3
3 -
 4
4 -
 5
5 -
 6
6 -
 7
7 -
 8
8 -
 9
9 -
 10
10 -
 11
11 -
 12
12 -
 13
13 -
 14
14 -
 15
15 -
 16
16 -
 17
17 -
 18
18 -
 19
19 -
 20
20 -
 21
21 -
 22
22 -
 23
23 -
24
-
25
-
26
-
27
-
28
-
29
-
30
-
31
-
32
-
33
-
34
-
35
-
36
-
37
-
38
-
39
-
40
-
41
-
42
-
43
-
44
-
45
-
46
-
47
-
48
-
49
-
50
-
51
-
52
-
53
-
54
-
55
-
56
-
57
-
58
-
59
-
60
-
61
-
62
-
63
-
64
-
65
-
66
-
67
-
68
-
69
-
70
-
71
-
72
-
73
-
74
-
75
-
76
-
77
-
78
-
79
-
80
-
81
-
82
-
83
-
84
-
85
-
86
-
87
-
88
-
89
-
90
-
91
-
92
-
93
-
94
-
95
-
96
-
97
-
98
-
99
-
100
-
101
-
102
-
103
-
104
-
105
-
106
-
107
-
108
-
109
-
110
-
111
-
112
-
113
-
114
-
115
-
116
-
117
-
118
-
119
-
120
-
121
-
122
-
123
-
124
-
125
-
126
-
127
-
128
-
129
-
130
-
131
-
132
-
133
-
134
-
135
-
136
-
137
-
138
-
139
-
140
-
141
-
142
-
143
-
144
-
145
-
146
-
147
-
148
-
149
-
150
-
151
-
152
-
153
-
154
-
155
-
156
-
157
-
158
-
159
-
160
-
161
-
162
-
163
-
164
-
165
-
166
-
167
-
168
-
169
-
170
-
171
-
172
-
173
-
174
-
175
-
176
-
177
-
178
-
179
-
180
-
181
-
182
-
183
-
184
-
185
-
186
-
187
-
188
-
189
-
190
-
191
-
192
-
193
-
194
-
195
-
196
-
197
-
198
-
199
-
200
-
201
-
202
-
203
-
204
-
205
-
206
-
207
-
208
-
209
-
210
-
211
-
212
-
213
-
214
-
215
-
216
-
217
-
218
-
219
-
220
-
221
-
222
-
223
-
224
-
225
-
226
-
227
-
228
-
229
-
230
-
231
-
232
-
233
-
234
-
235
-
236
-
237
-
238
-
239
-
240
-
241
-
242
-
243
-
244
-
245
-
246
-
247
-
248
-
249
-
250
-
251
-
252
-
253
 |
 |

10
Telstra Corporation Limited and controlled entities
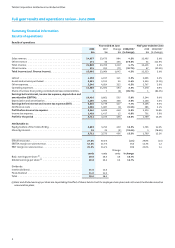
Full year results and operations review - June 2008
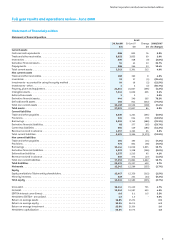
Statistical data summary
(i) Refer detail of data included in each product section.
Statistical data summary - Billable traffic data (i)
Year ended 30 June Half-year ended 30 June
2008 2007 Change Change 2008 2007 Change Change
mmm %mmm %
Fixed telephony
Number of local calls . . . . . . . . . . . . . . . . . . . . 5,680 6,528 (848) (13.0%) 2,689 3,138 (449) (14.3%)
National long distance minutes . . . . . . . . . . . . . 6,947 7,130 (183) (2.6%) 3,417 3,536 (119) (3.4%)
Fixed to mobile minutes . . . . . . . . . . . . . . . . . . 3,410 3,389 21 0.6% 1,696 1,693 3 0.2%
International direct minutes . . . . . . . . . . . . . . . 548 528 20 3.8% 275 264 11 4.2%
Mobiles
Mobile voice telephone minutes . . . . . . . . . . . . . 10,096 8,591 1,505 17.5% 5,177 4,445 732 16.5%
Number of short messaging service (SMS) sent . . . . 6,973 4,902 2,071 42.2% 3,749 2,675 1,074 40.1%
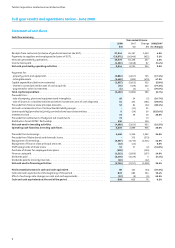
Statistical data summary - Services in operation (i)
Jun 08 vs Jun 07 Jun 08 vs Dec 07
As at Change Change Change Change
Jun 2008 Dec 2007 Jun 2007 %%
Fixed telephony
Basic access lines in service (in millions)
Residential . . . . . . . . . . . . . . . . . . . . . . . . . . . . . . . 5.56 5.53 5.56 - 0.0% 0.03 0.5%
Business . . . . . . . . . . . . . . . . . . . . . . . . . . . . . . . . . 2.31 2.29 2.22 0.09 4.1% 0.02 0.9%
Total retail customers. . . . . . . . . . . . . . . . . . . . . . . . . 7.87 7.82 7.78 0.09 1.2% 0.05 0.6%
Domestic wholesale. . . . . . . . . . . . . . . . . . . . . . . . . . 1.50 1.73 1.98 (0.48) (24.2%) (0.23) (13.3%)
Total basic access lines in services (in millions) . . . . . . . . 9.37 9.55 9.76 (0.39) (4.0%) (0.18) (1.9%)
ISDN access (basic lines equivalents) (in thousands). . . . . . 1,298 1,288 1,229 69 5.6% 10 0.8%
Unbundled local loop subscribers (in thousands). . . . . . . . 527 391 239 288 120.5% 136 34.8%
Mobiles
Mobile services in operation (in thousands) . . . . . . . . . . . 9,335 9,319 9,212 123 1.3% 16 0.2%
3GSM mobile subscribers (in thousands) . . . . . . . . . . . . . 4,352 3,295 2,003 2,349 117.3% 1,057 32.1%
Total wholesale mobile SIOs (in thousands) . . . . . . . . . . . 74 71 131 (57) (43.5%) 34.2%
Internet
Online subscribers (in thousands)
Broadband subscribers - retail . . . . . . . . . . . . . . . . . . . 3,269 2,866 2,406 863 35.9% 403 14.1%
Broadband subscribers - wholesale . . . . . . . . . . . . . . . . 1,708 1,753 1,762 (54) (3.1%) (45) (2.6%)
Total broadband subscribers . . . . . . . . . . . . . . . . . . . . 4,977 4,619 4,168 809 19.4% 358 7.8%
Narrowband subscribers . . . . . . . . . . . . . . . . . . . . . . . 530 595 654 (124) (19.0%) (65) (10.9%)
Total online subscribers (in thousands) . . . . . . . . . . . . . 5,507 5,214 4,822 685 14.2% 293 5.6%
Spectrum sharing services (in thousands) . . . . . . . . . . . . 436 377 304 132 43.4% 59 15.6%
Total FOXTEL† subscribers (exc wholesale) (in thousands) . 1,370 1,331 1,264 106 8.4% 39 2.9%
Employee data
Domestic full time staff . . . . . . . . . . . . . . . . . . . . . . . 33,982 34,236 35,706 (1,724) (4.8%) (254) (0.7%)
Full time staff and equivalents . . . . . . . . . . . . . . . . . . . 42,784 42,308 43,411 (627) (1.4%) 476 1.1%
Total workforce . . . . . . . . . . . . . . . . . . . . . . . . . . . . 46,649 46,561 47,840 (1,191) (2.5%) 88 0.2%