Telstra 2008 Annual Report Download - page 12
Download and view the complete annual report
Please find page 12 of the 2008 Telstra annual report below. You can navigate through the pages in the report by either clicking on the pages listed below, or by using the keyword search tool below to find specific information within the annual report.-
 1
1 -
 2
2 -
 3
3 -
 4
4 -
 5
5 -
 6
6 -
 7
7 -
 8
8 -
 9
9 -
 10
10 -
 11
11 -
 12
12 -
 13
13 -
 14
14 -
 15
15 -
 16
16 -
 17
17 -
 18
18 -
 19
19 -
 20
20 -
 21
21 -
 22
22 -
23
-
24
-
25
-
26
-
27
-
28
-
29
-
30
-
31
-
32
-
33
-
34
-
35
-
36
-
37
-
38
-
39
-
40
-
41
-
42
-
43
-
44
-
45
-
46
-
47
-
48
-
49
-
50
-
51
-
52
-
53
-
54
-
55
-
56
-
57
-
58
-
59
-
60
-
61
-
62
-
63
-
64
-
65
-
66
-
67
-
68
-
69
-
70
-
71
-
72
-
73
-
74
-
75
-
76
-
77
-
78
-
79
-
80
-
81
-
82
-
83
-
84
-
85
-
86
-
87
-
88
-
89
-
90
-
91
-
92
-
93
-
94
-
95
-
96
-
97
-
98
-
99
-
100
-
101
-
102
-
103
-
104
-
105
-
106
-
107
-
108
-
109
-
110
-
111
-
112
-
113
-
114
-
115
-
116
-
117
-
118
-
119
-
120
-
121
-
122
-
123
-
124
-
125
-
126
-
127
-
128
-
129
-
130
-
131
-
132
-
133
-
134
-
135
-
136
-
137
-
138
-
139
-
140
-
141
-
142
-
143
-
144
-
145
-
146
-
147
-
148
-
149
-
150
-
151
-
152
-
153
-
154
-
155
-
156
-
157
-
158
-
159
-
160
-
161
-
162
-
163
-
164
-
165
-
166
-
167
-
168
-
169
-
170
-
171
-
172
-
173
-
174
-
175
-
176
-
177
-
178
-
179
-
180
-
181
-
182
-
183
-
184
-
185
-
186
-
187
-
188
-
189
-
190
-
191
-
192
-
193
-
194
-
195
-
196
-
197
-
198
-
199
-
200
-
201
-
202
-
203
-
204
-
205
-
206
-
207
-
208
-
209
-
210
-
211
-
212
-
213
-
214
-
215
-
216
-
217
-
218
-
219
-
220
-
221
-
222
-
223
-
224
-
225
-
226
-
227
-
228
-
229
-
230
-
231
-
232
-
233
-
234
-
235
-
236
-
237
-
238
-
239
-
240
-
241
-
242
-
243
-
244
-
245
-
246
-
247
-
248
-
249
-
250
-
251
-
252
-
253
 |
 |

9
Telstra Corporation Limited and controlled entities
Full year results and operations review - June 2008
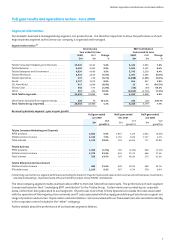
Telstra Wholesale
Our Telstra Wholesale business unit results declined from fiscal 2007 with total income declining 5.0%, sales revenue decreasing
by 4.5% and EBIT declining by 6.6%.
Total income has declined this fiscal year primarily driven by fixed revenues, particularly within the basic access products where
the revenues have decreased by 18.1% year on year. The Wholesale business continues to be impacted by increased ULL build
activity by our competitors as they migrate their customers to their on-net offering and the success of Telstra retail business units
in winning-back customers and increasing market share. The revenue decline has not been fully offset by increasing volumes of
ULL and facilities access revenues where low regulatory pricing has had a significant impact. The decline in PSTN revenues has
also been partially offset by increased mobiles interconnection and wholesale transmission revenues.
Total Wholesale expenses increased by 46.1% from fiscal 2007, driven significantly by the impact of higher network payments.
Included in fiscal 2007 was a backdated adjustment relating to the mobile terminating access rate (MTA) impact from an
Australian Competition and Consumer Commission (ACCC) final determination that was issued. As a result, network outpayments
increased year on year despite a lower MTA rate in the current year agreed with wholesale customers. On a segment basis, Telstra
Wholesale holds the impact of price variances year on year whilst the customer facing business units hold the volume impact of
this cost category.
Telstra Operations
Telstra Operations is primarily a cost generating unit supporting the revenue generating activities of our other segments. It has
experienced a decline in its negative EBIT contribution of 2.9% or $112 million to $3,998 million for fiscal 2008. This result includes
increased year on year volumes relating to higher revenue and costs associated with major fault repairs and network restoration
after extreme weather conditions.
Offsetting these costs was a significant reduction in labour expenses derived from the reduction in staff numbers within this
segment. Telstra Operations had the largest decrease across our business segments of 1,621 workforce equivalents this fiscal
year, particularly attributable to the streamlining of our field work force and call centres as part of the Transformation
programme. Telstra Operations finished this financial year with 17,785 total workforce equivalents.
Sensis, CSL New World and TelstraClear
Refer to more detailed discussion in the major subsidiaries section within this document.
Other
Our other segment primarily includes the Corporate centre functions of our business where we recognise the depreciation and
amortisation on fixed assets and redundancy expense for the Telstra Entity. Refer to the detailed discussion on these expense
categories throughout the fiscal 2008 results and operations review for further details.