Sunoco 2009 Annual Report Download - page 14
Download and view the complete annual report
Please find page 14 of the 2009 Sunoco annual report below. You can navigate through the pages in the report by either clicking on the pages listed below, or by using the keyword search tool below to find specific information within the annual report.-
 1
1 -
2
-
3
-
 4
4 -
 5
5 -
 6
6 -
 7
7 -
 8
8 -
 9
9 -
 10
10 -
 11
11 -
 12
12 -
 13
13 -
 14
14 -
 15
15 -
 16
16 -
 17
17 -
 18
18 -
 19
19 -
 20
20 -
 21
21 -
 22
22 -
 23
23 -
 24
24 -
25
-
26
-
27
-
28
-
29
-
30
-
31
-
32
-
33
-
34
-
35
-
36
-
37
-
38
-
39
-
40
-
41
-
42
-
43
-
44
-
45
-
46
-
47
-
48
-
49
-
50
-
51
-
52
-
53
-
54
-
55
-
56
-
57
-
58
-
59
-
60
-
61
-
62
-
63
-
64
-
65
-
66
-
67
-
68
-
69
-
70
-
71
-
72
-
73
-
74
-
75
-
76
-
77
-
78
-
79
-
80
-
81
-
82
-
83
-
84
-
85
-
86
-
87
-
88
-
89
-
90
-
91
-
92
-
93
-
94
-
95
-
96
-
97
-
98
-
99
-
100
-
101
-
102
-
103
-
104
-
105
-
106
-
107
-
108
-
109
-
110
-
111
-
112
-
113
-
114
-
115
-
116
-
117
-
118
-
119
-
120
-
121
-
122
-
123
-
124
-
125
-
126
-
127
-
128
 |
 |

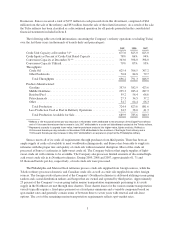
The following table sets forth Sunoco’s retail gasoline outlets at December 31, 2009, 2008 and 2007:
2009 2008 2007
Direct Outlets:
Company-Owned or Leased:
Company Operated:
Traditional ............................................. 70 88 91
APlus®Convenience Stores ................................ 325 438 458
395 526 549
Dealer Operated:
Traditional ............................................. 164 202 230
APlus®Convenience Stores ................................ 219 227 230
Ultra Service Centers®.................................... 112 122 135
495 551 595
Total Company-Owned or Leased* .............................. 890 1,077 1,144
Dealer Owned** ............................................. 509 578 575
Total Direct Outlets ............................................ 1,399 1,655 1,719
Distributor Outlets ............................................. 3,312 3,065 2,965
4,711 4,720 4,684
*Gasoline and diesel throughput per Company-owned or leased outlet averaged 151, 147 and 150 thousand gallons per month
during 2009, 2008 and 2007, respectively.
**Primarily traditional outlets.
Retail Marketing has a portfolio of outlets that differ in various ways including: product distribution to the
outlets; site ownership and operation; and types of products and services provided.
Direct outlets may be operated by Sunoco or by an independent dealer, and are sites at which fuel products
are delivered directly to the site by Sunoco trucks or by contract carriers. The Company or an independent dealer
owns or leases the property. These sites may be traditional locations that sell almost exclusively fuel products
under the Sunoco®and Coastal®brands or may include APlus®convenience stores or Ultra Service Centers®
that provide automotive diagnostics and repair. Included among Retail Marketing’s outlets at December 31, 2009
were 53 outlets on turnpikes and expressways in Pennsylvania, New Jersey, New York, Maryland and Delaware.
Of these outlets, 37 were Company-operated sites providing gasoline, diesel fuel and convenience store
merchandise.
Distributor outlets are sites in which the distributor takes delivery of fuel products at a terminal where
branded products are available. Sunoco does not own, lease or operate these locations.
During the 2007-2009 period, Sunoco generated $207 million of divestment proceeds related to the sale of
261 sites under a Retail Portfolio Management (“RPM”) program to selectively reduce the Company’s invested
capital in Company-owned or leased sites. Most of the sites were converted to contract dealers or distributors
thereby retaining most of the gasoline sales volume attributable to the divested sites within the Sunoco branded
business. There are currently approximately 90 sites in the program, of which approximately 25 are Company-
operated locations. These sites are expected to be divested or converted to contract dealers or distributors
primarily over the next two years, generating an estimated $80 million of divestment proceeds.
Branded fuels sales (including middle distillates) averaged 321.2 thousand barrels per day in 2009 compared
to 325.1 thousand barrels per day in 2008 and 341.6 thousand barrels per day in 2007.
6