Sunoco 2005 Annual Report Download - page 13
Download and view the complete annual report
Please find page 13 of the 2005 Sunoco annual report below. You can navigate through the pages in the report by either clicking on the pages listed below, or by using the keyword search tool below to find specific information within the annual report.
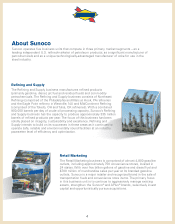
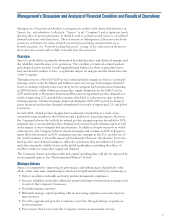
Refining and Supply
The Refining and Supply business manufactures petroleum products and commodity pet-
rochemicals at its Marcus Hook, Philadelphia, Eagle Point and Toledo refineries and petro-
leum and lubricant products at its Tulsa refinery and sells these products to other Sunoco
businesses and to wholesale and industrial customers. Refining operations are comprised of
Northeast Refining (the Marcus Hook, Philadelphia and Eagle Point refineries) and Mid-
Continent Refining (the Toledo and Tulsa refineries).
2005 2004 2003
Income (millions of dollars) $947 $541 $261
Wholesale margin* (per barrel):
Total Refining and Supply $8.65 $6.30 $4.76
Northeast Refining $8.35 $6.36 $4.63
MidContinent Refining $9.54 $6.12 $5.05
Throughputs** (thousands of barrels daily):
Crude oil 881.0 855.7 708.1
Other feedstocks 59.4 58.8 53.2
Total throughputs 940.4 914.5 761.3
Products manufactured** (thousands of barrels daily):
Gasoline 443.4 442.0 375.6
Middle distillates 319.5 300.3 236.7
Residual fuel 76.2 73.0 59.8
Petrochemicals 36.8 38.1 27.9
Lubricants 13.2 13.6 13.6
Other 86.6 82.0 77.6
Total production 975.7 949.0 791.2
Less: Production used as fuel in refinery operations 48.6 46.2 37.1
Total production available for sale 927.1 902.8 754.1
Crude unit capacity (thousands of barrels daily) at
December 31*** 900.0 890.0 730.0
Crude unit capacity utilized 98% 97% 97%
Conversion capacity†(thousands of barrels daily) at
December 31 372.0 361.7 306.7
Conversion capacity utilized 101% 98% 98%
* Wholesale sales revenue less related cost of crude oil, other feedstocks, product purchases and terminalling and transportation divided
by production available for sale.
** Data pertaining to the Eagle Point refinery for 2004 are based on the amounts attributable to the 354-day ownership period (January
13, 2004 – December 31, 2004) divided by 366, the number of days in the year.
*** Reflects an increase in January 2005 due to a 10 thousand barrels-per-day adjustment in MidContinent Refining and increases in
January 2004 due to the acquisition of the 150 thousand barrels-per-day Eagle Point refinery and another 10 thousand barrels-per-day
adjustment in MidContinent Refining.
†Represents capacity to upgrade lower-value, heavier petroleum products into higher-value, lighter products. Reflects increases in
January 2005 due to a 5.0 thousand barrels-per-day adjustment in Northeast Refining and a 5.3 thousand barrels-per-day adjustment
in MidContinent Refining and an increase in January 2004 as a result of the Eagle Point refinery acquisition.
The Refining and Supply segment results increased $406 million in 2005 largely due to
higher realized margins ($467 million) and higher production volumes ($41 million). The
higher realized margins reflect strong demand, the effect of supply disruptions on the Gulf
Coast due to Hurricanes Katrina and Rita and the use of discounted high-acid crude oils in
Northeast Refining. Since mid-2004, Refining and Supply has gradually increased the
processing of such crude oils, which averaged approximately 56 thousand barrels per day in
2005. Partially offsetting these factors were higher expenses ($110 million), primarily fuel
and employee-related charges.
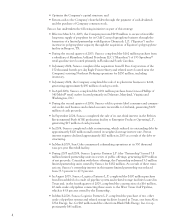
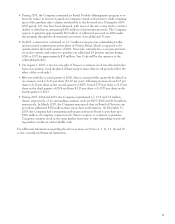
Refining and Supply segment results increased $280 million in 2004. In addition to a $135
million income contribution from the Eagle Point refinery, the improvement was primarily
due to higher realized margins ($234 million) resulting largely from low industry inventory
levels, particularly for distillate products, and stronger product demand. Also contributing
11


