Stein Mart 2012 Annual Report Download - page 15
Download and view the complete annual report
Please find page 15 of the 2012 Stein Mart annual report below. You can navigate through the pages in the report by either clicking on the pages listed below, or by using the keyword search tool below to find specific information within the annual report.-
 1
1 -
2
-
3
-
4
-
 5
5 -
 6
6 -
 7
7 -
 8
8 -
 9
9 -
 10
10 -
 11
11 -
 12
12 -
 13
13 -
 14
14 -
 15
15 -
 16
16 -
 17
17 -
 18
18 -
 19
19 -
 20
20 -
 21
21 -
 22
22 -
 23
23 -
 24
24 -
 25
25 -
26
-
27
-
28
-
29
-
30
-
31
-
32
-
33
-
34
-
35
-
36
-
37
-
38
-
39
-
40
-
41
-
42
-
43
-
44
-
45
-
46
-
47
-
48
-
49
-
50
-
51
-
52
-
53
-
54
-
55
-
56
-
57
-
58
-
59
-
60
 |
 |

13
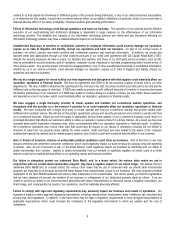
Performance Graph
The following graph compares the cumulative five-year stockholder return on our common stock with the cumulative total return to the
NASDAQ Composite Index and the S&P 500 Apparel Retail Index. The comparison assumes $100 was invested at the beginning of the
five year period in Stein Mart, Inc. stock and in each of the indices shown and assumes reinvestment of any dividends.
$0
$20
$40
$60
$80
$100
$120
$140
$160
$180
$200
$220
$240
$260
2/2/2008 1/31/2009 1/30/2010 1/29/2011 1/28/2012 2/2/2013
DOLLARS
Stein Mart, Inc. NASDAQ Composite S&P 500 Apparel Retail
2/2/2008 1/31/2009 1/30/2010 1/29/2011 1/28/2012 2/2/2013
Stein Mart, Inc. $100.00 $19.9 $134.6 $142.9 $133.2 $178.3
NASDAQ Composite 100.00 62.0 90.9 114.9 122.7 140.6
S&P 500 A
pp
arel Retail 100.00 50.1 99.1 129.8 171.1 230.8
* * * * *
The stock performance graph should not be deemed filed or incorporated by reference into any other filings made by us under the
Securities Act of 1933 or the Securities Exchange Act of 1934, except to the extent that we specifically incorporate the stock performance
graph by reference in another filing.