Stein Mart 2009 Annual Report Download - page 16
Download and view the complete annual report
Please find page 16 of the 2009 Stein Mart annual report below. You can navigate through the pages in the report by either clicking on the pages listed below, or by using the keyword search tool below to find specific information within the annual report.-
 1
1 -
2
-
3
-
4
-
5
-
 6
6 -
 7
7 -
 8
8 -
 9
9 -
 10
10 -
 11
11 -
 12
12 -
 13
13 -
 14
14 -
 15
15 -
 16
16 -
 17
17 -
 18
18 -
 19
19 -
 20
20 -
 21
21 -
 22
22 -
 23
23 -
 24
24 -
 25
25 -
 26
26 -
27
-
28
-
29
-
30
-
31
-
32
-
33
-
34
-
35
-
36
-
37
-
38
-
39
-
40
-
41
-
42
-
43
-
44
-
45
-
46
-
47
-
48
 |
 |

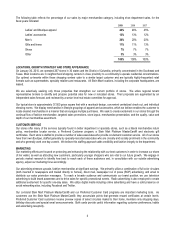
Operating losses from closed stores include the following store closing and asset impairment charges (in thousands):
2009 2008 2007
Lease termination costs $1,789 $3,568 $ 889
Asset impairment charges - 2,010 771
Severance 569 1,129 256
Total $2,358 $6,707 $1,916
Year Ended January 30, 2010 Compared to Year Ended January 31, 2009
Net sales for the year ended January 30, 2010 were $1,219.1 million, down 8.1 percent from $1,326.5 million for the prior year. The
$107.4 million decrease reflects a $69.7 million decrease in the comparable store group and a $47.9 million decrease in the closed
store group, offset by a $10.2 million increase in the non-comparable store group due to the inclusion of sales for the two stores
opened in 2009 and the six stores opened in 2008. The closed store group includes the 11 stores closed in 2009 and 10 stores
closed in 2008. Comparable stores sales for 2009 decreased 5.6 percent compared to 2008.
Although sales decreased in 2009, gross profit for year ended January 30, 2010 increased to $330.4 million or 27.1 percent of net
sales from $294.2 million or 22.2 percent of net sales for the prior year. The $36.1 million increase in gross profit reflects a $37.9
million increase in the comparable store group and a $3.2 million increase in the non-comparable store group, partially offset by a
$5.0 million decrease in the closed store group. Gross profit as a percent of sales increased during fiscal 2009 due to a 4.6
percentage point decrease in markdowns and a 1.1 percentage point increase in markup, offset by a 0.8 percentage point decrease in
buying and occupancy costs. Markdowns were lower in 2009 due to lower inventory levels and lower levels of clearance
merchandise.
SG&A expenses were $314.1 million or 25.8 percent of net sales for the year ended January 30, 2010 as compared to $394.8 million
or 29.8 percent of net sales for 2008. SG&A expenses for 2009 include $11.1 million of non-cash pre-tax asset impairment and store
closing charges compared to $25.4 million in 2008. Asset impairment charges were $11.6 million higher last year due to a greater
number of stores with projected cash flows that did not support the carrying value of their long-lived assets. Store closing charges
were $2.7 million higher last year because two closings occurred before the end of the lease term resulting in higher store closing
reserve charges for continuing lease obligations.
Excluding asset impairment and store closing charges, SG&A expenses were $303.0 million or 24.9 percent of sales in 2009
compared to $369.4 million or 27.8 percent of sales in 2008. This $66.4 million decrease in SG&A expenses reflects a $45.8 million
reduction in store operating expenses, a $13.7 million decrease in non-buying expenses in the corporate office, a $5.6 million
decrease in depreciation expense and a $1.3 million decrease in advertising expense. Store operating expenses decreased $35.4
million for the comparable and non-comparable store group due to headcount reductions and other cost saving initiatives and
decreased $10.4 million for the closed store group. Corporate office expenses decreased from 2008 primarily due to compensation
and benefit reductions related to expense reduction initiatives and lower consulting fees. Depreciation expense decreased as a result
of asset impairment charges taken during the fourth quarter of 2008. Advertising expense was slightly lower this year primarily due to
reduced spending on direct mail marketing and newspaper advertising.
Pre-opening expenses for the two stores opened in 2009 and the six stores opened in 2008 amounted to $0.3 million and $1.5 million,
respectively.
Other income, net decreased $2.0 million in 2009 compared to 2008 due to a decrease in the number of credit cards issued through
our co-brand credit card program offset slightly by income from our new magazine subscription program.
Interest expense, net decreased $1.5 million in 2009 compared to 2008 as a result of our having no direct borrowings since the first
quarter of 2009. During the third quarter of 2008, we borrowed an additional $75 million on our revolving credit agreement which
increased our notes payable to banks balance to $100 million. We maintained that notes payable balance through January 31, 2009,
investing excess borrowings in short-term money market funds, and liquidated these money market funds and repaid that portion of
the borrowings during the first quarter of 2009.
The effective tax rate (“ETR”) was 31.5 percent in 2009 compared to a tax benefit of 12.9 percent in 2008. The 2008 rate was
unusually low due to our recording a $19.0 million deferred tax asset valuation allowance through a charge to tax expense during the
fourth quarter of 2008. We recorded the valuation allowance because 2008 operating results produced a cumulative three-year loss,
which is considered a significant factor that is difficult to overcome when determining if a valuation allowance is required. Although we
were profitable in 2009, we remain in a cumulative three-year loss. We perform a quarterly assessment of net deferred tax assets
14