Stein Mart 2009 Annual Report Download - page 15
Download and view the complete annual report
Please find page 15 of the 2009 Stein Mart annual report below. You can navigate through the pages in the report by either clicking on the pages listed below, or by using the keyword search tool below to find specific information within the annual report.-
 1
1 -
2
-
3
-
4
-
 5
5 -
 6
6 -
 7
7 -
 8
8 -
 9
9 -
 10
10 -
 11
11 -
 12
12 -
 13
13 -
 14
14 -
 15
15 -
 16
16 -
 17
17 -
 18
18 -
 19
19 -
 20
20 -
 21
21 -
 22
22 -
 23
23 -
 24
24 -
 25
25 -
26
-
27
-
28
-
29
-
30
-
31
-
32
-
33
-
34
-
35
-
36
-
37
-
38
-
39
-
40
-
41
-
42
-
43
-
44
-
45
-
46
-
47
-
48
 |
 |

x We expect SG&A savings from supply chain will be similar to 2009 savings and should slightly more than offset the addbacks of
compensation and related expenses that were temporarily lowered in 2009.
x We plan to relocate five to ten stores to better locations in their respective markets. We also plan to close four and open three
stores for a net planned decrease of one store by year-end. New stores will have negligible incremental profit benefit in 2010 as
their partial year results will be largely offset by pre-opening costs that are expensed when the stores are opened.
x Our effective tax rate will continue to fluctuate due to the impact of book/tax differences on our deferred tax valuation allowance.
x Capital expenditures are planned at approximately $30 million compared to $7.6 million in 2009. Approximately $20 million is for
system improvements, with the largest portion for a new merchandise information system. The remaining capital amounts are to
upgrade our store fixtures in connection with our new and relocated stores.
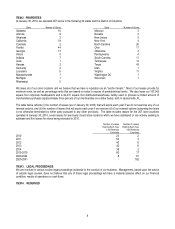
Stores
There were 267 stores open as of January 30, 2010, 276 stores as of January 31, 2009 and 280 stores as of February 2, 2008.
2009 2008 2007
Stores at beginning of year 276 280 268
Stores opened during the year 2 6 14
Stores closed during the year (11) (10) (2)
Stores at end of year 267 276 280
While we are always interested in looking at exceptional real estate opportunities, our focus for 2010 will primarily be on relocating
existing stores to better real estate. We are reviewing current situations where leases will be ending or have provisions for early
termination and hope to take advantage of this real estate market and lock in better locations in some markets where there is
additional opportunity.
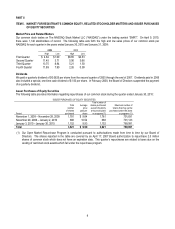
Results of Operations
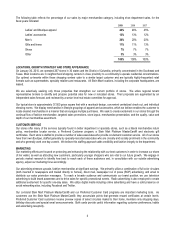
The following table sets forth each line item of the Consolidated Statements of Operations expressed as a percentage of net sales
(numbers may not add due to rounding):
2009 2008 2007
Net sales 100.0% 100.0% 100.0%
Cost of merchandise sold 72.9 77.8 75.2
Gross profit 27.1 22.2 24.8
Selling, general and administrative expenses 25.8 29.8 26.7
Other income, net 1.5 1.5 1.5
Income (loss) from operations 2.8 (6.0) (0.4)
Interest expense, net - (0.1) (0.1)
Income (loss) before income taxes 2.8 (6.2) (0.5)
Income tax (provision) benefit (0.9) 0.8 0.1
Net income (loss) 1.9% (5.4)% (0.3)%
Store Closings
During 2009, 2008 and 2007, we closed 23 under-performing stores. The table below sets forth the impact on operations in each of
the presented years for stores closed in that and subsequent years (in thousands). The 2009 table presents the losses from the 11
stores that closed during 2009. The 2008 table presents the sum of the losses from the 11 stores that closed during 2009 and the 10
stores that closed during 2008; the 2007 table presents the sum of the losses from the 11 stores that closed during 2009, the 10
stores that closed during 2008 and the two stores that closed during 2007.
2009 2008 2007
Sales $17,226 $65,151 $86,085
Cost of merchandise sold 12,987 55,917 70,060
Gross profit 4,239 9,234 16,025
Selling, general and administrative expenses 6,429 23,059 23,009
Other income, net 203 655 840
Loss from operations $(1,987) $(13,170) $(6,144)
# of stores closed in 2007-2009 11 21 23
13