Starwood 2011 Annual Report Download - page 156
Download and view the complete annual report
Please find page 156 of the 2011 Starwood annual report below. You can navigate through the pages in the report by either clicking on the pages listed below, or by using the keyword search tool below to find specific information within the annual report.-
 1
1 -
2
-
3
-
4
-
5
-
6
-
7
-
8
-
9
-
10
-
11
-
12
-
13
-
14
-
15
-
16
-
17
-
18
-
19
-
20
-
21
-
22
-
23
-
24
-
25
-
26
-
27
-
28
-
29
-
30
-
31
-
32
-
33
-
34
-
35
-
36
-
37
-
38
-
39
-
40
-
41
-
42
-
43
-
44
-
45
-
46
-
47
-
48
-
49
-
50
-
51
-
52
-
53
-
54
-
55
-
56
-
57
-
58
-
59
-
60
-
61
-
62
-
63
-
64
-
65
-
66
-
67
-
68
-
69
-
70
-
71
-
72
-
73
-
74
-
75
-
76
-
77
-
78
-
79
-
80
-
81
-
82
-
83
-
84
-
85
-
86
-
87
-
88
-
89
-
90
-
91
-
92
-
93
-
94
-
95
-
96
-
97
-
98
-
99
-
100
-
101
-
102
-
103
-
104
-
105
-
106
-
107
-
108
-
109
-
110
-
111
-
112
-
113
-
114
-
115
-
116
-
117
-
118
-
119
-
120
-
121
-
122
-
123
-
124
-
125
-
126
-
127
-
128
-
129
-
130
-
131
-
132
-
133
-
134
-
135
-
136
-
137
-
138
-
139
-
140
-
141
-
142
-
143
-
144
-
145
-
 146
146 -
 147
147 -
 148
148 -
 149
149 -
 150
150 -
 151
151 -
 152
152 -
 153
153 -
 154
154 -
 155
155 -
 156
156 -
 157
157 -
 158
158 -
 159
159 -
 160
160 -
 161
161 -
 162
162 -
 163
163 -
 164
164 -
 165
165 -
 166
166 -
167
-
168
-
169
 |
 |

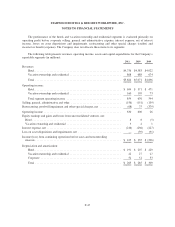
STARWOOD HOTELS & RESORTS WORLDWIDE, INC.
NOTES TO FINANCIAL STATEMENTS
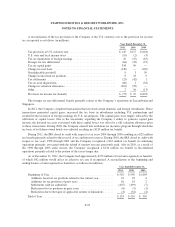
The dividend yield is estimated based on the current expected annualized dividend payment and the average
expected price of the Company’s common shares during the same periods.
The estimated volatility is based on a combination of historical share price volatility as well as implied
volatility based on market analysis. The historical share price volatility was measured over an 8-year period,
which is equal to the contractual term of the options. The weighted average volatility for 2011 grants was 39%.
The expected life represents the period that the Company’s stock-based awards are expected to be
outstanding and was determined based on an actuarial calculation using historical experience, giving
consideration to the contractual terms of the stock-based awards and vesting schedules.
The yield curve (risk-free interest rate) is based on the implied zero-coupon yield from the U.S. Treasury
yield curve over the expected term of the option.
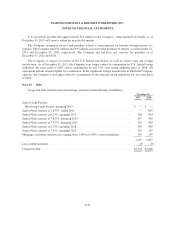
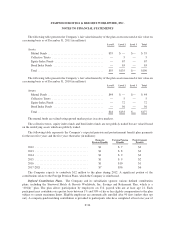
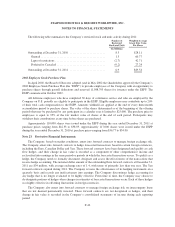
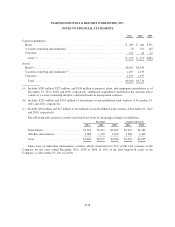
The following table summarizes the Company’s stock option activity during 2011:
Options
(In Millions)
Weighted Average
Exercise
Price Per Share
Outstanding at December 31, 2010 ............................ 8.7 $29.72
Granted ............................................... 0.3 61.28
Exercised .............................................. (2.3) 31.01
Forfeited, Canceled or Expired ............................. — —
Outstanding at December 31, 2011 ............................ 6.7 $30.70
Exercisable at December 31, 2011 ............................ 3.6 $39.53
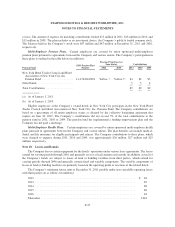
The weighted-average fair value per option for options granted during 2011, 2010 and 2009 was $21.84,
$14.73, and $4.69, respectively, and the service period is typically four years. The total intrinsic value of options
exercised during 2011, 2010 and 2009 was approximately $62 million, $115 million and $1 million, respectively,
resulting in tax benefits of approximately $23 million, $44 million and $0.3 million, respectively.
The aggregate intrinsic value of outstanding options as of December 31, 2011 was $128 million. The
aggregate intrinsic value of exercisable options as of December 31, 2011 was $39 million. The weighted-average
contractual life was 4.1 years for outstanding options and 3.0 years for exercisable option as of December 31,
2011.
The Company recognizes compensation expense, equal to the fair market value of the stock on the date of
grant for restricted stock and unit grants, over the service period. The weighted-average fair value per restricted
stock or unit granted during 2011, 2010 and 2009 was $60.77, $37.33 and $11.15, respectively. The service
period is typically three or four years except in the case of restricted stock and units issued in lieu of a portion of
an annual cash bonus where the restriction period is typically in equal installments over a two year period, or in
equal installments on the first, second and third fiscal year ends following grant date with distribution on the
third fiscal year end.
The fair value of restricted stock and units for which the restrictions lapsed during 2011, 2010 and 2009 was
approximately $154 million, $62 million and $33 million, respectively.
F-39