Starwood 2004 Annual Report Download - page 125
Download and view the complete annual report
Please find page 125 of the 2004 Starwood annual report below. You can navigate through the pages in the report by either clicking on the pages listed below, or by using the keyword search tool below to find specific information within the annual report.-
 1
1 -
2
-
3
-
4
-
5
-
6
-
7
-
8
-
9
-
10
-
11
-
12
-
13
-
14
-
15
-
16
-
17
-
18
-
19
-
20
-
21
-
22
-
23
-
24
-
25
-
26
-
27
-
28
-
29
-
30
-
31
-
32
-
33
-
34
-
35
-
36
-
37
-
38
-
39
-
40
-
41
-
42
-
43
-
44
-
45
-
46
-
47
-
48
-
49
-
50
-
51
-
52
-
53
-
54
-
55
-
56
-
57
-
58
-
59
-
60
-
61
-
62
-
63
-
64
-
65
-
66
-
67
-
68
-
69
-
70
-
71
-
72
-
73
-
74
-
75
-
76
-
77
-
78
-
79
-
80
-
81
-
82
-
83
-
84
-
85
-
86
-
87
-
88
-
89
-
90
-
91
-
92
-
93
-
94
-
95
-
96
-
97
-
98
-
99
-
100
-
101
-
102
-
103
-
104
-
105
-
106
-
107
-
108
-
109
-
110
-
111
-
112
-
113
-
114
-
 115
115 -
 116
116 -
 117
117 -
 118
118 -
 119
119 -
 120
120 -
 121
121 -
 122
122 -
 123
123 -
 124
124 -
 125
125 -
 126
126 -
 127
127 -
 128
128 -
 129
129 -
 130
130 -
 131
131 -
 132
132 -
 133
133 -
 134
134 -
 135
135 -
136
-
137
-
138
-
139
 |
 |

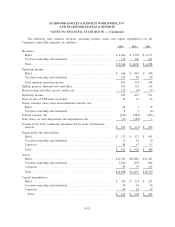
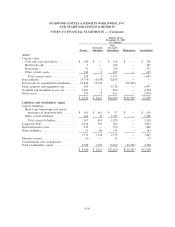
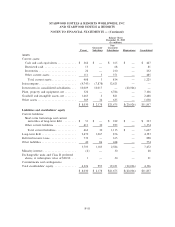
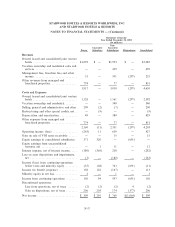
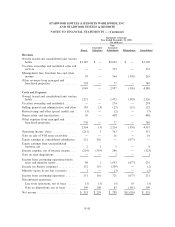
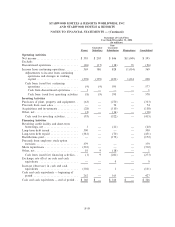
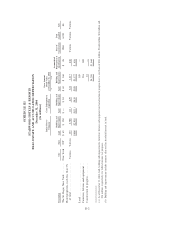
STARWOOD HOTELS & RESORTS WORLDWIDE, INC.
AND STARWOOD HOTELS & RESORTS
NOTES TO FINANCIAL STATEMENTS Ì (Continued)
Statement of Cash Flows
Year Ended December 31, 2004
(In millions)
Non-
Guarantor Guarantor
Parent Subsidiary Subsidiaries Eliminations Consolidated
Operating Activities
Net incomeÏÏÏÏÏÏÏÏÏÏÏÏÏÏÏÏÏÏÏÏÏÏÏÏÏÏÏÏÏ $ 395 $ 203 $ 846 $(1,049) $ 395
Exclude:
Discontinued operations ÏÏÏÏÏÏÏÏÏÏÏÏÏÏÏÏÏÏ (26) (17) (18) 35 (26)
Income from continuing operations ÏÏÏÏÏÏÏÏÏ 369 186 828 (1,014) 369
Adjustments to income from continuing
operations and changes in working
capital ÏÏÏÏÏÏÏÏÏÏÏÏÏÏÏÏÏÏÏÏÏÏÏÏÏÏÏÏÏ (378) (195) (233) 1,014 208
Cash from (used for) continuing
operations ÏÏÏÏÏÏÏÏÏÏÏÏÏÏÏÏÏÏÏÏÏÏÏÏÏÏ (9) (9) 595 Ì 577
Cash from discontinued operations ÏÏÏÏÏ 1 Ì Ì Ì 1
Cash from (used for) operating activities (8) (9) 595 Ì 578
Investing Activities
Purchases of plant, property and equipmentÏÏ (63) Ì (270) Ì (333)
Proceeds from asset sales ÏÏÏÏÏÏÏÏÏÏÏÏÏÏÏÏÏ Ì Ì 74 Ì 74
Acquisitions and investments ÏÏÏÏÏÏÏÏÏÏÏÏÏÏ (28) Ì (110) Ì (138)
Other, net ÏÏÏÏÏÏÏÏÏÏÏÏÏÏÏÏÏÏÏÏÏÏÏÏÏÏÏÏÏÏ (2) Ì (16) Ì (18)
Cash used for investing activitiesÏÏÏÏÏÏÏÏÏ (93) Ì (322) Ì (415)
Financing Activities
Revolving credit facility and short-term
borrowings, netÏÏÏÏÏÏÏÏÏÏÏÏÏÏÏÏÏÏÏÏÏÏÏÏ 1 Ì (21) Ì (20)
Long-term debt issued ÏÏÏÏÏÏÏÏÏÏÏÏÏÏÏÏÏÏÏ 300 Ì Ì Ì 300
Long-term debt repaid ÏÏÏÏÏÏÏÏÏÏÏÏÏÏÏÏÏÏÏ (381) Ì (70) Ì (451)
Distributions paidÏÏÏÏÏÏÏÏÏÏÏÏÏÏÏÏÏÏÏÏÏÏÏÏ Ì Ì (172) Ì (172)
Proceeds from employee stock option
exercises ÏÏÏÏÏÏÏÏÏÏÏÏÏÏÏÏÏÏÏÏÏÏÏÏÏÏÏÏÏ 379 Ì Ì Ì 379
Share repurchases ÏÏÏÏÏÏÏÏÏÏÏÏÏÏÏÏÏÏÏÏÏÏÏ (310) Ì Ì Ì (310)
Other, net ÏÏÏÏÏÏÏÏÏÏÏÏÏÏÏÏÏÏÏÏÏÏÏÏÏÏÏÏÏÏ 10 9 (18) Ì 1
Cash from (used for) Ñnancing activities ÏÏ (1) 9 (281) Ì (273)
Exchange rate eÅect on cash and cash
equivalents ÏÏÏÏÏÏÏÏÏÏÏÏÏÏÏÏÏÏÏÏÏÏÏÏÏÏÏ Ì Ì 9 Ì 9
Increase (decrease) in cash and cash
equivalents ÏÏÏÏÏÏÏÏÏÏÏÏÏÏÏÏÏÏÏÏÏÏÏÏÏÏÏ (102) Ì 1 Ì (101)
Cash and cash equivalents Ì beginning of
period ÏÏÏÏÏÏÏÏÏÏÏÏÏÏÏÏÏÏÏÏÏÏÏÏÏÏÏÏÏÏÏ 262 Ì 165 Ì 427
Cash and cash equivalents Ì end of period ÏÏ $ 160 $ Ì $ 166 $ Ì $ 326
F-59