Southwest Airlines 2013 Annual Report Download - page 1
Download and view the complete annual report
Please find page 1 of the 2013 Southwest Airlines annual report below. You can navigate through the pages in the report by either clicking on the pages listed below, or by using the keyword search tool below to find specific information within the annual report.-
 1
1 -
 2
2 -
 3
3 -
 4
4 -
 5
5 -
 6
6 -
 7
7 -
 8
8 -
 9
9 -
 10
10 -
 11
11 -
 12
12 -
13
-
14
-
15
-
16
-
17
-
18
-
19
-
20
-
21
-
22
-
23
-
24
-
25
-
26
-
27
-
28
-
29
-
30
-
31
-
32
-
33
-
34
-
35
-
36
-
37
-
38
-
39
-
40
-
41
-
42
-
43
-
44
-
45
-
46
-
47
-
48
-
49
-
50
-
51
-
52
-
53
-
54
-
55
-
56
-
57
-
58
-
59
-
60
-
61
-
62
-
63
-
64
-
65
-
66
-
67
-
68
-
69
-
70
-
71
-
72
-
73
-
74
-
75
-
76
-
77
-
78
-
79
-
80
-
81
-
82
-
83
-
84
-
85
-
86
-
87
-
88
-
89
-
90
-
91
-
92
-
93
-
94
-
95
-
96
-
97
-
98
-
99
-
100
-
101
-
102
-
103
-
104
-
105
-
106
-
107
-
108
-
109
-
110
-
111
-
112
-
113
-
114
-
115
-
116
-
117
-
118
-
119
-
120
-
121
-
122
-
123
-
124
-
125
-
126
-
127
-
128
-
129
-
130
-
131
-
132
-
133
-
134
-
135
-
136
-
137
-
138
-
139
-
140
 |
 |

SOUTHWEST AIRLINES CO.
2013 ANNUAL REPORT TO SHAREHOLDERS
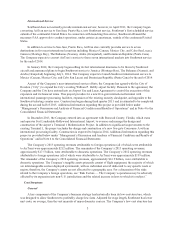
To our Shareholders:
Our goals for 2013 were ambitious. We wanted to stay on track with our five Strategic
Initiatives described below. We wanted to maintain our strong Brand, unique Culture, and
award-winning Customer Service. We wanted to sustain our strong ontime performance and
baggage handling. Finally, we wanted to improve our cost performance, achieve our profit
requirement, and return value to our Shareholders. Just like in 2011 and 2012, an enormous
amount was accomplished in 2013. As a result, we produced stellar results.
Our 2013 net income was a record $754 million, or $1.05 per diluted share, including
special items (primarily noncash, mark-to-market, and other items required for a portion of the
Company’s fuel hedge portfolio, as well as costs associated with the acquisition and integration
of AirTran). Excluding special items1, our 2013 profits were also a record, increasing 93
percent year-over-year to $805 million, or $1.12 per diluted share. Our annual pre-tax return on
invested capital, excluding special items (ROIC), was 13.1 percent, nearly doubling 2012’s
performance.
Total operating revenues were a record $17.7 billion, boosted by strong yields and an 80.1
percent load factor. Through the combination of stable fuel prices and rigorous cost control
efforts, we met our goal to improve our cost performance. Despite a roller coaster economy,
we achieved record earnings; and, while just short of our 15 percent ROIC target, we produced
the best ROIC since 2000. Our stock price rose 84 percent in 2013 and reached an all-time
high, split-adjusted, closing price of $23.98 a share on March 17 of this year. I applaud the
outstanding People of Southwest and AirTran for these strong results, which earned them a
record $228 million contribution to the ProfitSharing Plan for the year 2013.
We preserved our financial strength and returned value to our Shareholders, as planned.
As of December 31, 2013, our cash and short-term investments were a strong $3.2 billion, with
a fully-available $1 billion bank line-of-credit. In May 2013, our Board of Directors authorized
an increase in our previous share repurchase authorization to $1.5 billion, and quadrupled our
quarterly dividend. These actions, coupled with the generation of a healthy $1.03 billion in free
cash flow2during 2013, enabled us to return $611 million to Shareholders through repurchases
of $540 million of common stock (38 million shares) and distribution of $71 million in dividends.
We repaid $313 million in debt and capital lease obligations during 2013. As a result, our debt-
to-total capital ratio (including aircraft leases) declined to approximately 38 percent at yearend.
All told, our invested capital base was reduced by approximately $1 billion during 2013. We
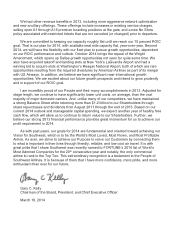
remain the only investment grade-rated U.S. airline.
1Additional information regarding non-GAAP financial measures is included in the accompanying Form 10-K for the fiscal year
ended December 31, 2013.
2Free cash flow is calculated as operating cash flows of $2.48 billion less capital expenditures of $1.45 billion.