Southwest Airlines 2010 Annual Report Download - page 8
Download and view the complete annual report
Please find page 8 of the 2010 Southwest Airlines annual report below. You can navigate through the pages in the report by either clicking on the pages listed below, or by using the keyword search tool below to find specific information within the annual report.-
 1
1 -
 2
2 -
 3
3 -
 4
4 -
 5
5 -
 6
6 -
 7
7 -
 8
8 -
 9
9 -
 10
10 -
 11
11 -
 12
12 -
 13
13 -
 14
14 -
 15
15 -
 16
16 -
 17
17 -
 18
18 -
 19
19 -
20
-
21
-
22
-
23
-
24
-
25
-
26
-
27
-
28
-
29
-
30
-
31
-
32
-
33
-
34
-
35
-
36
-
37
-
38
-
39
-
40
-
41
-
42
-
43
-
44
-
45
-
46
-
47
-
48
-
49
-
50
-
51
-
52
-
53
-
54
-
55
-
56
-
57
-
58
-
59
-
60
-
61
-
62
-
63
-
64
-
65
-
66
-
67
-
68
-
69
-
70
-
71
-
72
-
73
-
74
-
75
-
76
-
77
-
78
-
79
-
80
-
81
-
82
-
83
-
84
-
85
-
86
-
87
-
88
-
89
-
90
-
91
-
92
-
93
-
94
-
95
-
96
-
97
-
98
-
99
-
100
-
101
-
102
-
103
-
104
-
105
-
106
-
107
-
108
-
109
-
110
-
111
-
112
-
113
-
114
-
115
-
116
-
117
-
118
-
119
-
120
 |
 |
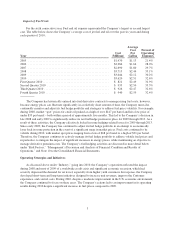
during 2010, (i) the economy, as well as consumer behavior patterns, remained uncertain; (ii) fuel prices
increased significantly over 2009; and (iii) the U.S. airline industry generally continued to exercise capacity
restraint. The resulting leaner flight schedules, along with improving demand and fares, have led to significant
improvements in industry load factors (percentage of seats filled by fare-paying passengers).
Company Operations
Route Structure
The Company principally provides point-to-point service, rather than the “hub-and-spoke” service provided
by most major U.S. airlines (often referred to as “legacy airlines”). The hub-and-spoke system concentrates most
of an airline’s operations at a limited number of central hub cities and serves most other destinations in the
system by providing one-stop or connecting service through a hub. Any issue at a hub, such as bad weather or a
security problem, can create delays throughout the system. By not concentrating operations through one or more
central transfer points, the Company’s point-to-point route structure allows for more direct non-stop routing than
hub-and-spoke service and therefore better enables the Company to control delays and total trip time.
Approximately 73 percent of the Company’s Customers flew non-stop during 2010, and the Company’s average
aircraft trip stage length in 2010 was 648 miles with an average duration of approximately 1.8 hours.
Approximately 76 percent of the Company’s Customers flew non-stop during 2009, and the Company’s average
aircraft trip stage length in 2009 was 639 miles with an average duration of approximately 1.8 hours. The 2010
decrease in percentage of non-stop Customers reflects, in part, the Company’s network optimization efforts,
which included publishing more itineraries with enhanced connecting opportunities and which as a result
contributed to improved load factors. The Company’s network optimization is discussed in more detail below
under “Operating Strategies and Initiatives – Network Optimization; Revenue Management.”
The Company’s point-to-point service also enables it to provide its markets with frequent, conveniently
timed flights. Examples of markets offering frequent daily flights are: Dallas Love Field to Houston Hobby, 25
weekday roundtrips; Phoenix to Las Vegas, 14 weekday roundtrips; and Los Angeles International to Oakland,
14 weekday roundtrips. The Company complements these high-frequency short-haul routes with long-haul,
nonstop service between markets such as Los Angeles and Nashville, Las Vegas and Orlando, and San Diego and
Baltimore. As of December 31, 2010, the Company served 460 non-stop city pairs.
Cost Structure
A key component of the Company’s business strategy is its low cost structure, which is designed to allow it
to profitably charge low fares. Adjusted for stage length, the Company has lower unit costs, on average,
than most major carriers. The Company’s low cost structure is currently facilitated by the Company’s reliance
upon a single aircraft type, its operationally efficient point-to-point route structure, and its highly productive
Employees. The Company’s current use of a single aircraft type, the Boeing 737, enables it to simplify
scheduling, maintenance, flight operations, and training activities. The Company’s point-to-point route structure
includes service to and from many secondary or downtown airports such as Dallas Love Field, Houston Hobby,
Chicago Midway, Baltimore-Washington International, Burbank, Manchester, Oakland, San Jose, Providence,
Ft. Lauderdale/Hollywood, and Long Island Islip airports. These conveniently located airports are typically less
congested than other airlines’ hub airports, which enables the Company to achieve high asset utilization because
aircraft can be scheduled to minimize the amount of time they are on the ground. This in turn reduces the number
of aircraft and gate facilities that would otherwise be required and allows for high Employee productivity
(headcount per aircraft).
2