Southwest Airlines 2010 Annual Report Download - page 1
Download and view the complete annual report
Please find page 1 of the 2010 Southwest Airlines annual report below. You can navigate through the pages in the report by either clicking on the pages listed below, or by using the keyword search tool below to find specific information within the annual report.-
 1
1 -
 2
2 -
 3
3 -
 4
4 -
 5
5 -
 6
6 -
 7
7 -
 8
8 -
 9
9 -
 10
10 -
 11
11 -
 12
12 -
13
-
14
-
15
-
16
-
17
-
18
-
19
-
20
-
21
-
22
-
23
-
24
-
25
-
26
-
27
-
28
-
29
-
30
-
31
-
32
-
33
-
34
-
35
-
36
-
37
-
38
-
39
-
40
-
41
-
42
-
43
-
44
-
45
-
46
-
47
-
48
-
49
-
50
-
51
-
52
-
53
-
54
-
55
-
56
-
57
-
58
-
59
-
60
-
61
-
62
-
63
-
64
-
65
-
66
-
67
-
68
-
69
-
70
-
71
-
72
-
73
-
74
-
75
-
76
-
77
-
78
-
79
-
80
-
81
-
82
-
83
-
84
-
85
-
86
-
87
-
88
-
89
-
90
-
91
-
92
-
93
-
94
-
95
-
96
-
97
-
98
-
99
-
100
-
101
-
102
-
103
-
104
-
105
-
106
-
107
-
108
-
109
-
110
-
111
-
112
-
113
-
114
-
115
-
116
-
117
-
118
-
119
-
120
 |
 |

SOUTHWEST AIRLINES CO.
2010 ANNUAL REPORT TO SHAREHOLDERS
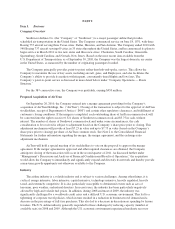
To our Shareholders:
With 2010 in the history books, the first decade of the new century is behind
us. For the U.S. airline industry, the past ten years will forever be known as the “lost
decade”—fewer passengers, fewer flights, fewer airplanes, and fewer aviation jobs.
Faced with the worst economic recession in aviation history, a world-wide credit crisis,
and astronomical jet fuel prices, the airline industry endured billions of lost dollars and
numerous bankruptcies and liquidations. And yet, while not immune to the economic
collapse, brutal competition, and energy price volatility, Southwest Airlines prevailed.
We emerged from the worst decade in aviation history without bankruptcy, without
furloughs, without pay cuts, and without degradation of our Customer experience.
And, 2010 marked our 38th consecutive year of profitability. What a tremendous
accomplishment for the hard-working, high-spirited Employees of Southwest Airlines.
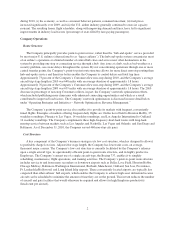
Our 2010 net income was $459 million, or $.61 per diluted share, compared to
$99 million, or $.13 per diluted share, for 2009. Each year includes special items
(primarily noncash, mark-to-market, and other items required for a portion of the
Company’s fuel hedge portfolio). Excluding special items from each year, our 2010
profit increased 285 percent to $550 million, or a record $.74 per diluted share,
compared to $143 million, or $.19 per diluted share, for 2009.
We remained financially strong with unrestricted cash and short-term
investments of $3.5 billion as of December 31, 2010. We also had a fully-available
$600 million bank line-of-credit. Our debt-to-total capital was approximately
40 percent, and we remained the only investment grade-rated U.S. airline.
We began 2010 amid escalating fuel prices and a fragile domestic economy.
Last year at this time, I said that our 2010 net income might improve from 2009’s
meager results. Clearly, our 2010 results were much stronger than we anticipated.
Overall demand for our low fares and high quality Customer Service strengthened. In
the second half of the year, business travel rebounded considerably. We consistently
achieved record monthly load factors, ending the year with a record annual load factor
of 79.3 percent. And, boosted by our Bags Fly Free and No Change Fees, our share
of the domestic market grew to 21 percent as the largest domestic carrier in terms of
originating passengers boarded, compared to 20 percent a year ago (based on third
quarter 2010 and third quarter 2009 data, respectively, from the U.S. Department of
Transportation (DOT)).