Sonic 2015 Annual Report Download
Download and view the complete annual report
Please find the complete 2015 Sonic annual report below. You can navigate through the pages in the report by either clicking on the pages listed below, or by using the keyword search tool below to find specific information within the annual report.-
 1
1 -
 2
2 -
 3
3 -
 4
4 -
 5
5 -
 6
6 -
 7
7 -
 8
8 -
 9
9 -
 10
10 -
 11
11 -
 12
12 -
13
-
14
-
15
-
16
-
17
-
18
-
19
-
20
-
21
-
22
-
23
-
24
-
25
-
26
-
27
-
28
-
29
-
30
-
31
-
32
-
33
-
34
-
35
-
36
-
37
-
38
-
39
-
40
-
41
-
42
-
43
-
44
-
45
-
46
-
47
-
48
-
49
-
50
-
51
-
52
 |
 |

2015 Annual Report
Building a
Stronger
Brand
Table of contents
-
Page 1
Building a Stronger Brand 2015 Annual Report -
Page 2
..., positions us as one of the most highly differentiated concepts in the quick-service restaurant (QSR) industry. Unique, signature menu items are made when you order and include chicken sandwiches, popcorn chicken and chicken strips; footlong quarter pound coneys and six-inch premium beef hot dogs... -
Page 3
...% Net income for fiscal 2015 increased 30% on an adjusted basis to $1.09 per diluted share. $143 Million Sonic returned more than $143 million to shareholders last year through cash dividends and stock repurchases. $1.24 Million During fiscal 2015, Sonic achieved record average sales per drive-in... -
Page 4
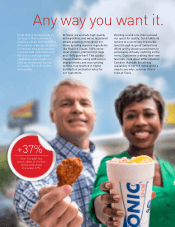
... fiscal 2016, with the first quarterly cash payment already made in the first quarter. At the heart of this success lies our unrelenting focus on food quality, variety and innovation - a multi-year mission that continues to excite the tastes of our customers. Ingredients such as Real Ice Cream, 100... -
Page 5
..., Sonic's media strategies continue to resonate with our audience and help drive sales, volume and customer enthusiasm. Our ongoing success in all of these areas increasingly provides our franchisees with a strong financial validation for expansion in new and existing markets. During fiscal 2015... -
Page 6
... our menu by using superior ingredients like Real Ice Cream, 100% whitemeat chicken, premium hot dogs and 100% pure beef. This quality transformation, along with service improvements and more pricing options, has resulted in higher satisfaction and better value for our customers. Building a solid... -
Page 7
...new Ice Cream Cake Shakes and Waffle Cones added heft to an already impressive selection of shakes, blasts, sundaes, slushes and floats made with our signature Real Ice Cream. See pages 6-7 to learn how we bring our menu to life through technology initiatives. And you can't forget the drinks: Sonic... -
Page 8
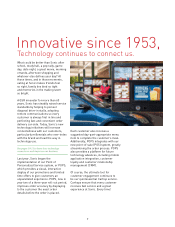
Tech Standout At August 31, 2015, approximately 31% of our drive-ins interacted with customers differently with POPS. 6 -
Page 9
... the order is placed. Each customer also receives a suggested day-part-appropriate menu item to complete the customer's meal. Additionally, POPS integrates with our new point-of-sale (POS) system, greatly streamlining the order process. POPS also provides a platform for future technology advances... -
Page 10
In early 2013, Sonic made an important change to its media strategy, extending national cable advertising on a year-round basis. The utilization of national cable advertising across many of the most popular networks was not new for Sonic; it already had proven to be an effective means of taking our ... -
Page 11
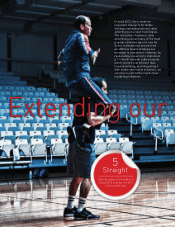
... time Sonic enters a new market, we encounter an eager fan base - thrilled that the wait is over. It translates into higher average unit volumes for the Sonic system, volumes that exceeded more than $1 million for all market types in fiscal 2015 and volumes that hit new records every month last year... -
Page 12
.... 45 Rhode Island marked Sonic's 45th state and opened in October 2015. Sweet Home Chicago A few years ago, Sonic introduced its smaller footprint drive-in prototype to provide franchisees with added flexibility to adapt Sonic Drive-Ins to more limited settings for densely populated markets and... -
Page 13
... new media strategies and emerging technology to turn his business around in amazing ways, not only in terms of sales growth, but also for customer service and satisfaction along with improved employee morale. It's no wonder that Grey is on board to open five more drive-ins over the next five years... -
Page 14
..., net, reflecting various changes in tax matters, including a benefit of prior-year statutory tax deduction and a change in the deferred tax valuation allowance. System-wide Drive-Ins 2015 Business Mix 3,526 3,561 3,556 3,522 3,518 89% 11% 2011 2012 2013 2014 2015 Franchise Drive-Ins Company... -
Page 15
...Data: Company Drive-In sales Franchise Drive-Ins: Franchise royalties and fees Lease revenue Other Total revenues Cost of Company Drive-In sales Selling, general and administrative Depreciation and amortization Provision for impairment of long-lived assets Other operating (income) expense, net Total... -
Page 16
...sales volumes of Franchise Drive-Ins. Franchise royalties and franchise fees are directly affected by the number of operating Franchise Drive-Ins and new drive-in openings. Lease revenues are generated primarily by the leasing of land and buildings for Company Drive-In operations that have been sold... -
Page 17
...of $1.6 million related to the write-off of assets associated with a change in the vendor for the Sonic system's new point-of-sale technology. The following table provides information regarding the number of Company Drive-Ins and Franchise Drive-Ins operating as of the end of the years indicated as... -
Page 18
... Franchise Drive-Ins: Franchise royalties Franchise fees Lease revenue Other Total revenues $ The following table reflects the changes in sales and same-store sales at Company Drive-Ins. It also presents information about average unit volumes and the number of Company Drive-Ins, which is useful... -
Page 19
... Total at beginning of year Opened Acquired from (sold to) the Company, net Closed (net of re-openings) Total at end of year Average sales per Franchise Drive-In Change in same-store sales(2) Franchising revenues(3) Percentage increase (decrease) Effective royalty rate(4) (1) (2) (3) (4) Drive... -
Page 20
...marketing, telephone and utilities, repair and maintenance, rent, property tax and other controllable expenses. Percentage Company Drive-In Margins Points Year Ended August 31, Increase 2015 2014 (Decrease) Costs and expenses: Company Drive-Ins: Food and packaging Payroll and other employee benefits... -
Page 21
...2015, we used $42.2 million of cash for investments in property and equipment as outlined in the table below (in millions). Purchase and replacement of equipment and technology Brand technology investments Acquisition of underlying real estate for drive-ins Newly constructed drive-ins leased or sold... -
Page 22
Management's Discussion and Analysis of Financial Condition and Results of Operations These purchases decreased $36.8 million in fiscal year 2015 compared to the same period last year mainly due to the completion of the new technology installations at Company Drive-Ins during the first quarter of ... -
Page 23
.... In August 2015, the Board of Directors further extended the Company's share repurchase program, authorizing the Company to purchase up to $145 million of its outstanding shares of common stock through August 31, 2016. Share repurchases will be made from time to time in the open market or otherwise... -
Page 24
...estimated share of system-wide commitments to purchase food products. We have excluded agreements that are cancelable without penalty. These amounts require estimates and could vary due to the timing of volumes and changes in market pricing. Includes $3.6 million of unrecognized tax benefits related... -
Page 25
...stock-based payments reflect our best estimates, but involve uncertainties relating to market and other conditions, many of which are outside of our control. We estimate expected volatility based on historical daily price changes of the Company's stock for a period equal to the current expected term... -
Page 26
... of debt-related costs. At August 31, 2015, the fair value of the 2011 Fixed Rate Notes and 2013 Fixed Rate Notes approximated their carrying value of $428.1 million, including accrued interest. To derive the fair value, management used market information available for public debt transactions... -
Page 27
... cash Notes receivable, net Property, equipment and capital leases, net Goodwill Other assets, net Total assets Liabilities and stockholders' equity Current liabilities: Accounts payable Franchisee deposits Accrued liabilities Income taxes payable Current maturities of long-term debt and capital... -
Page 28
...Ins: Franchise royalties and fees Lease revenue Other Total revenues Costs and expenses: Company Drive-Ins: Food and packaging Payroll and other employee benefits Other operating expenses, exclusive of depreciation and amortization included below Total cost of Company Drive-In sales Selling, general... -
Page 29
... Other Balance at August 31, 2014 Net income Cash dividends Stock-based compensation expense Purchase of treasury stock Exercise of stock options and issuance of restricted stock Other Balance at August 31, 2015 Common Stock $ 1,183 1,183 1,183 1,183 Paid-in Capital $ 230,543 - 3,630 - (6,127... -
Page 30
... stock options Payment of dividends Debt issuance and extinguishment costs Other Net cash used in financing activities Net increase (decrease) in cash and cash equivalents Cash and cash equivalents at beginning of year Cash and cash equivalents at end of year Supplemental cash flow information Cash... -
Page 31
...2015, 2014 and 2013 (In thousands, except per share data) 1. Summary of Significant Accounting Policies Operations Sonic Corp. (the "Company") operates and franchises a chain of quick-service restaurants in the United States. It derives its revenues primarily from Company Drive-In sales and royalty... -
Page 32
... of capital leases are computed by the straight-line method over the estimated useful lives or the lease term, including cancelable option periods when appropriate, and are combined for presentation in the financial statements. Accounting for Long-Lived Assets The Company reviews long-lived assets... -
Page 33
... fees are generally recognized upon the opening of a Franchise Drive-In or upon termination of the agreement between the Company and the franchisee. The Company's franchisees pay royalties based on a percentage of sales. Royalties are recognized as revenue when they are earned. Advertising Costs... -
Page 34
... for doubtful accounts. • Long-term debt - The Company prepares a discounted cash flow analysis for its fixed rate borrowings to estimate fair value each quarter. This analysis uses Level 2 inputs from market information available for public debt transactions for companies with ratings that are... -
Page 35
...to fair value. The Company's assessment in fiscal year 2013 resulted in provisions for impairment totaling $1.8 million. Of this total, $1.6 million related to the write-off of assets associated with a change in the vendor providing technology for the Sonic system's new point-of-sale technology. The... -
Page 36
... of capital expenditures for planned technology initiatives and closed 12 lower-performing Company Drive-Ins as of August 31, 2013, resulting in a loss of $2.4 million. The loss included rent accruals for the remaining lease term, write-down of real estate and other costs associated with store... -
Page 37
... capital leases that have initial or remaining noncancelable lease terms in excess of one year as of August 31, 2015, are as follows: Operating Years ended August 31: 2016 2017 2018 2019 2020 Thereafter Total minimum lease payments(1) Less amount representing interest averaging 6.3% Present value... -
Page 38
..., 2015, the Company had three drive-ins under construction with costs to complete. Interest incurred in connection with the construction of new drive-ins and technology projects is capitalized. Capitalized interest was $0.4 million, $0.5 million and $0.7 million for fiscal years 2015, 2014 and 2013... -
Page 39
... and the 2013 Fixed Rate Notes are not paid in full by the end of their expected lives, they are subject to an upward adjustment in the interest rate of at least 5% per annum. In addition, principal payments will accelerate by applying all of the royalties, lease revenues and other fees securing the... -
Page 40
... date. The Company's cash equivalents are carried at cost which approximates fair value and totaled $41.1 million and $34.4 million at August 31, 2015 and 2014, respectively. This fair value is estimated using Level 1 methods. At August 31, 2015, the fair value of the Company's 2011 Fixed Rate... -
Page 41
... to the following for the fiscal years ended August 31: 2015 2014 2013 Amount computed by applying a tax rate of 35% $ 32,103 $ 25,818 $ 19,705 State income taxes (net of federal income tax benefit) 1,330 2,562 1,572 Employment related and other tax credits, net (2,096) (1,537) (1,572) Federal tax... -
Page 42
...option exercises, the vesting of RSUs and shares issued under the ESPP. Total stock-based compensation cost recognized for fiscal years 2015, 2014 and 2013 was $3.5 million, $3.7 million and $3.6 million, respectively, net of related income tax benefits of $1.0 million, $1.7 million and $1.2 million... -
Page 43
... activity under the Company's stock-based compensation plans for the year ended August 31, 2015, is presented in the following table: Weighted Weighted Average Average Remaining Exercise Contractual Price Life (Yrs.) $ 12.73 31.08 14.56 19.77 $ 14.00 3.38 $ 10.46 2.55 Outstanding September 1, 2014... -
Page 44
... fair value of RSUs that vested was $1.1 million during the years ended August 31, 2015 and 2014 and was $0.9 million for the year ended August 31, 2013. Stock Repurchase Programs In August 2012, the Company's Board of Directors approved a share repurchase program authorizing the Company to purchase... -
Page 45
... not pay any cash dividends on its common stock prior to fiscal 2015. The future declaration of quarterly dividends and the establishment of future record and payment dates are subject to the final determination of the Company's Board of Directors. 14. Employee Benefit and Cash Incentive Plans The... -
Page 46
... valuation allowance during the fourth quarter of fiscal year 2015. Also includes a $0.5 million tax benefit resulting from the IRS's acceptance of a federal tax method change during the first quarter of fiscal year 2014. The sum of per share data may not agree to annual amounts due to rounding. 44 -
Page 47
... as a whole, presents fairly, in all material respects, the information set forth therein. We also have audited, in accordance with the standards of the Public Company Accounting Oversight Board (United States), Sonic Corp.'s internal control over financial reporting as of August 31, 2015, based on... -
Page 48
... adequate internal control over financial reporting. The Company's internal control system was designed to provide reasonable assurance to the Company's management and Board of Directors regarding the preparation and fair presentation of published financial statements. All internal control systems... -
Page 49
... in Internal Control - Integrated Framework (2013) issued by COSO. We also have audited, in accordance with the standards of the Public Company Accounting Oversight Board (United States), the consolidated balance sheets of Sonic Corp. and subsidiaries as of August 31, 2015 and 2014, and the related... -
Page 50
... Vice President and Real Estate Counsel Rochelle L. Guinn Vice President of Human Resources Compliance and Technology Ralph F. Heim Vice President of Media and Integrated Marketing Corey R. Horsch Vice President of Investor Relations and Treasurer M. Anne Hughes Vice President of Internal Audit... -
Page 51
.... The table below sets forth our high and low sales prices for the Company's common stock and cash dividends paid during each fiscal quarter within the two most recent fiscal years. Fiscal Year Ended August 31, 2015 High $ 27.88 $ 33.15 $ 36.73 $ 34.23 Dividends Per Low Common Share $ 21.10 $ 0.09... -
Page 52
300 Johnny Bench Drive • Oklahoma City, OK 73104 sonicdrivein.com