Sonic 2007 Annual Report Download - page 2
Download and view the complete annual report
Please find page 2 of the 2007 Sonic annual report below. You can navigate through the pages in the report by either clicking on the pages listed below, or by using the keyword search tool below to find specific information within the annual report.-
 1
1 -
 2
2 -
 3
3 -
 4
4 -
 5
5 -
 6
6 -
 7
7 -
 8
8 -
 9
9 -
 10
10 -
 11
11 -
 12
12 -
 13
13 -
14
-
15
-
16
-
17
-
18
-
19
-
20
-
21
-
22
-
23
-
24
-
25
-
26
-
27
-
28
-
29
-
30
-
31
-
32
-
33
-
34
-
35
-
36
-
37
-
38
-
39
-
40
-
41
-
42
-
43
-
44
-
45
-
46
 |
 |

2007 2006 Change
($ in thousands, except per share data)
Operations (for the year)
Total revenues $ 770,469 $693,262 11%
Income from operations $ 145,289 $131,627 10%
Net income per diluted share $ 0.91 $ 0.88 3%
Net income per diluted share,
excluding debt extinguishment
charges 1$0.96 $0.88 9%
Weighted average diluted shares
outstanding 70,592 89,239 -21%
System Information (for the year or at year's end)
Partner drive-ins 2654 623 5%
Franchise drive-ins 2,689 2,565 5%
System-wide drive-ins 33,343 3,188 5%
System-wide average drive-in sales 3$ 1,109 $ 1,070 4%
Change in system-wide sales 38.6%10.7%
Change in system-wide same-store sales 3, 4 3.1% 4.5%
Financial Highlights
1 Excludes $0.05 in special items
associated with Sonic's tender offer
and subsequent financing activities.
Net income per diluted share,
excluding debt extinguishment
charges, is a non-GAAP financial
measure. We believe net income per
diluted share,excluding debt
extinguishment charges, provides
additional insight into the strength
of our operations and aids in the
comparability of current- and prior-
year results.
2 Partner drive-ins are those Sonic
Drive-Ins in which we own a majority
interest, typically at least 60%. Most
supervisors and managers of partner
drive-ins own a minority equity
interest.
3 System-wide information, which
combines partner drive-in and
franchise drive-in information, is a
non-GAAP measure. We believe
system-wide information is useful in
analyzing the growth of the Sonic
brand as well as our revenues, since
franchisees pay royalties based on a
percentage of sales.
4 Changes in same-store sales based
on drive-ins open for at least 15
months.
Sonic began in 1953 in Shawnee, Oklahoma. Today, we franchise and operate the largest chain of drive-
in restaurants in the country, with more than 3,300 Sonic Drive-Ins from coast to coast.
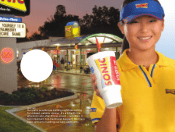
Our drive-in experience, together with a unique menu and personalized Carhop service, position us as
one of the most highly differentiated concepts in the quick-service restaurant (QSR) industry. At a typical
Sonic Drive-In, customers park in one of 24 to 36 canopy-covered spaces and place orders through an
intercom speaker system. A smiling Carhop delivers the customer's order car-side, usually within four
minutes. Customers also may enjoy drive-thru service at many Sonic locations.
Sonic Drive-Ins feature signature menu items, offering made-when-you-order Extra-Long Chili Cheese
Coneys, hamburgers, wraps and other sandwiches, hand-battered Onion Rings, Tater Tots and a full
breakfast menu. We are known for our variety of Frozen Favorites®treats and Fountain Favorites®
drinks, too, like Cherry Limeades, Slushes and Cream Pie Shakes, making Sonic Your Ultimate Drink Stop®.
Sonic also offers a variety of choice for health-conscious customers, including Fresh Tastes®salads and
several low-calorie drinks, including a diet version of our classic Cherry Limeade.
Company Profile