Sonic 2004 Annual Report Download - page 3
Download and view the complete annual report
Please find page 3 of the 2004 Sonic annual report below. You can navigate through the pages in the report by either clicking on the pages listed below, or by using the keyword search tool below to find specific information within the annual report.-
 1
1 -
 2
2 -
 3
3 -
 4
4 -
 5
5 -
 6
6 -
 7
7 -
 8
8 -
 9
9 -
 10
10 -
 11
11 -
 12
12 -
 13
13 -
 14
14 -
15
-
16
-
17
-
18
-
19
-
20
-
21
-
22
-
23
-
24
-
25
-
26
-
27
-
28
-
29
-
30
-
31
-
32
-
33
-
34
-
35
-
36
-
37
-
38
-
39
-
40
 |
 |

Net Income Per
Diluted Share
2004 2003 Percent Change
($ in thousands, except per share data)
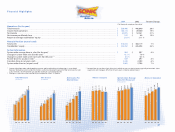
Operations (for the year)
Total revenues . . . . . . . . . . . . . . . . . . . . . . . . . . . . . . . . . . . . . . . . . . . . . . . . . . . . . . . . . . . . . . . . . . . . . . . . . . . . . . . . . . . . . . . . . . . . . . . . . . . . . . . . . . . . . . . . $ 536,446 $ 446,640 20 %
Income from operations . . . . . . . . . . . . . . . . . . . . . . . . . . . . . . . . . . . . . . . . . . . . . . . . . . . . . . . . . . . . . . . . . . . . . . . . . . . . . . . . . . . . . . . . . . . . . . . . . . . . . . . $ 106,114 $ 89,500 19 %
Net income . . . . . . . . . . . . . . . . . . . . . . . . . . . . . . . . . . . . . . . . . . . . . . . . . . . . . . . . . . . . . . . . . . . . . . . . . . . . . . . . . . . . . . . . . . . . . . . . . . . . . . . . . . . . . . . . . . . $ 63,015 $ 52,261 21 %
Net income per diluted share . . . . . . . . . . . . . . . . . . . . . . . . . . . . . . . . . . . . . . . . . . . . . . . . . . . . . . . . . . . . . . . . . . . . . . . . . . . . . . . . . . . . . . . . . . . . . . . . . . $ 1.02 $ .86 19 %
Return on average stockholders' equity . . . . . . . . . . . . . . . . . . . . . . . . . . . . . . . . . . . . . . . . . . . . . . . . . . . . . . . . . . . . . . . . . . . . . . . . . . . . . . . . . . . . . . . . 21.0 % 21.1 %
Financial Position (at year's end)
Total assets . . . . . . . . . . . . . . . . . . . . . . . . . . . . . . . . . . . . . . . . . . . . . . . . . . . . . . . . . . . . . . . . . . . . . . . . . . . . . . . . . . . . . . . . . . . . . . . . . . . . . . . . . . . . . . . . . . . $ 518,633 $ 486,119 7 %
Stockholders' equity . . . . . . . . . . . . . . . . . . . . . . . . . . . . . . . . . . . . . . . . . . . . . . . . . . . . . . . . . . . . . . . . . . . . . . . . . . . . . . . . . . . . . . . . . . . . . . . . . . . . . . . . . . . $ 334,762 $ 265,398 26 %
System Information
System-wide average drive-in sales (for the year) 1 . . . . . . . . . . . . . . . . . . . . . . . . . . . . . . . . . . . . . . . . . . . . . . . . . . . . . . . . . . . . . . . . . . . . . . . . . . . . . . $ 964 $ 907 6 %
Change in system-wide sales (for the year) 1 . . . . . . . . . . . . . . . . . . . . . . . . . . . . . . . . . . . . . . . . . . . . . . . . . . . . . . . . . . . . . . . . . . . . . . . . . . . . . . . . . . . . 13.1 %7.0 %
Change in system-wide same-store sales (for the year) 1, 2 . . . . . . . . . . . . . . . . . . . . . . . . . . . . . . . . . . . . . . . . . . . . . . . . . . . . . . . . . . . . . . . . . . . . . . . 6.5 % 0.3 %
Partner drive-ins (at year's end) 3 . . . . . . . . . . . . . . . . . . . . . . . . . . . . . . . . . . . . . . . . . . . . . . . . . . . . . . . . . . . . . . . . . . . . . . . . . . . . . . . . . . . . . . . . . . . . . . . 539 497 8 %
Franchise drive-ins (at year's end) . . . . . . . . . . . . . . . . . . . . . . . . . . . . . . . . . . . . . . . . . . . . . . . . . . . . . . . . . . . . . . . . . . . . . . . . . . . . . . . . . . . . . . . . . . . . . . 2,346 2,209 6 %
System-wide drive-ins (at year's end) 1 . . . . . . . . . . . . . . . . . . . . . . . . . . . . . . . . . . . . . . . . . . . . . . . . . . . . . . . . . . . . . . . . . . . . . . . . . . . . . . . . . . . . . . . . . 2,885 2,706 7 %
Financial Highlights
p.1
Total Revenues
(In millions)
Net Income
(In millions)
Return on Equity
‘00 ‘01 ‘02 ‘03 ‘04 ‘00 ‘01 ‘02 ‘03 ‘04 ‘00 ‘01 ‘02 ‘03 ‘04‘00 ‘01 ‘02 ‘03 ‘04
$536
$447
$400
$331
$280
$33
$39
$48
$52
$63
$.52
$.62
$.75
$.86
$1.02
21.9%
22.1%
21.1%
21.0%
21.4%
System-wide Average
Sales Per Restaurant
(In thousands)
$853
$874
$906
$907
$964
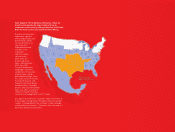
Stores in Operation
2,175
2,359
2,533
2,706
2,885
‘00 ‘01 ‘02 ‘03 ‘04 ‘00 ‘01 ‘02 ‘03 ‘04
1System-wide information, which combines partner and franchise drive-in information, is a non-GAAP
measure. We believe system-wide information is useful in analyzing the growth of the Sonic brand as well
as our revenues, since franchisees pay royalties based on a percentage of sales.
2Changes in same-store sales based on drive-ins open for at least 15 months.
3Partner Drive-Ins are those Sonic Drive-Ins in which we own a majority interest, typically at least 60%. Most
supervisors and managers of Partner Drive-Ins own a minority equity interest.