Sonic 2003 Annual Report Download - page 4
Download and view the complete annual report
Please find page 4 of the 2003 Sonic annual report below. You can navigate through the pages in the report by either clicking on the pages listed below, or by using the keyword search tool below to find specific information within the annual report.-
 1
1 -
 2
2 -
 3
3 -
 4
4 -
 5
5 -
 6
6 -
 7
7 -
 8
8 -
 9
9 -
 10
10 -
 11
11 -
 12
12 -
 13
13 -
 14
14 -
 15
15 -
16
-
17
-
18
-
19
-
20
-
21
-
22
-
23
-
24
-
25
-
26
-
27
-
28
-
29
-
30
-
31
-
32
-
33
-
34
-
35
-
36
-
37
-
38
-
39
-
40
-
41
-
42
-
43
-
44
-
45
-
46
-
47
-
48
-
49
-
50
-
51
-
52
 |
 |

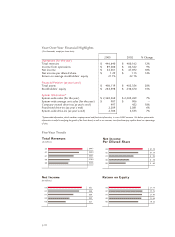
$447
$400
$331
$280
$258
Year-Over-Year Financial Highlights
($ in thousands, except per share data)
2003 2002 % Change
Operations (for the year)
Total revenues $ 446,640 $ 400,162 12%
Income from operations $ 89,500 $ 82,322 9%
Net income $ 52,261 $ 47,692 10%
Net income per diluted share $ 1.29 $ 1.13 14%
Return on average stockholders’ equity 21.1% 22.1%
Financial Position (at year’s end)
Total assets $ 486,119 $ 405,356 20%
Stockholders’ equity $ 265,398 $ 230,670 15%
System Information*
System-wide sales (for the year) $ 2,360,360 $ 2,205,269 7%
System-wide average unit sales (for the year) $ 907 $ 906 --
Company-owned drive-ins (at year’s end) 497 452 10%
Franchised drive-ins (at year’s end) 2,209 2,081 6%
System-wide drive-ins (at year’s end) 2,706 2,533 7%
*System-wide information, which combines company-owned and franchise information, is a non-GAAP measure. We believe system-wide
information is useful in analyzing the growth of the Sonic brand, as well as our revenues, since franchisees pay royalties based on a percentage
of sales.
Total Revenues
(In millions)
03
02
01
00
99
Net Income
(In millions)
03
02
01
00
99
$52
$48
$39
$33
$27
Net Income
Per Diluted Share
03
02
01
00
99
$1.29
$1.13
$ .93
$ .78
$ .63
Return on Equity
03
02
01
00
99
21.1%
22.1%
21.9%
21.4%
19.4%
Five-Year Trends
p.02