Sally Beauty Supply 2011 Annual Report Download - page 6
Download and view the complete annual report
Please find page 6 of the 2011 Sally Beauty Supply annual report below. You can navigate through the pages in the report by either clicking on the pages listed below, or by using the keyword search tool below to find specific information within the annual report.-
 1
1 -
 2
2 -
 3
3 -
 4
4 -
 5
5 -
 6
6 -
 7
7 -
 8
8 -
 9
9 -
 10
10 -
 11
11 -
 12
12 -
 13
13 -
 14
14 -
 15
15 -
 16
16 -
 17
17 -
18
-
19
-
20
-
21
-
22
-
23
-
24
-
25
-
26
-
27
-
28
-
29
-
30
-
31
-
32
-
33
-
34
-
35
-
36
-
37
-
38
-
39
-
40
-
41
-
42
-
43
-
44
-
45
-
46
-
47
-
48
-
49
-
50
-
51
-
52
-
53
-
54
-
55
-
56
-
57
-
58
-
59
-
60
-
61
-
62
-
63
-
64
-
65
-
66
-
67
-
68
-
69
-
70
-
71
-
72
-
73
-
74
-
75
-
76
-
77
-
78
-
79
-
80
-
81
-
82
-
83
-
84
-
85
-
86
-
87
-
88
-
89
-
90
-
91
-
92
-
93
-
94
-
95
-
96
-
97
-
98
-
99
-
100
-
101
-
102
-
103
-
104
-
105
-
106
-
107
-
108
-
109
-
110
-
111
-
112
-
113
-
114
-
115
-
116
-
117
-
118
-
119
-
120
-
121
-
122
-
123
-
124
-
125
-
126
-
127
-
128
-
129
-
130
-
131
-
132
-
133
-
134
-
135
-
136
-
137
-
138
-
139
-
140
-
141
-
142
-
143
-
144
-
145
-
146
-
147
-
148
-
149
-
150
-
151
-
152
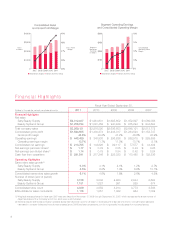
 |
 |

Segment Operating Earnings
and Consolidated Operating Margin
14%
16%
$450
$600
10%
$150
2007 2008 2010 20112009
12%
$300
08%
Segment
Operating
Earnings
in millions
Consolidated
Operating Profit
Margin
Sally Beauty Supply Beauty Systems Group
48%
49%
$3,000
$4,000
46%
$1,000
2007 2008 2010 20112009
47%
$2,000
045%
Consolidated Sales
and Gross Profit Margin
Sales
in millions
Gross Profit
Margin
Sally Beauty Supply Beauty Systems Group
Fiscal Year Ended September 30,
Dollarsinthousands,exceptpershareamounts 2011 2010 2009 2008 2007
Financial Highlights
Net sales
Sally Beauty Supply $ 2,012,407 $1,834,631 $1,695,652 $1,672,897 $1,569,088
Beauty Systems Group $ 1,256,724 $1,081,459 $ 940,948 $ 975,294 $ 944,684
Total company sales $ 3,269,131 $2,916,090 $2,636,600 $2,648,191 $2,513,772
Consolidated gross profit $ 1,594,605 $1,404,374 $1,243,317 $1,234,594 $1,153,747
Gross profit margin 48.8% 48.2% 47.2% 46.6% 45.9%
Operating earnings $ 448,469 $ 340,930 $ 296,836 $ 282,915 $ 228,585
Operating earnings margin 13.7% 11.7% 11.3% 10.7% 9.1%
Consolidated net earnings $ 213,725 $ 143,828 $ 99,117 $ 77,577 $ 44,492
Net earnings per basic share(1) $ 1.17 $ 0.79 $ 0.55 $ 0.43 $ 0.25
Net earnings per diluted share(1) $ 1.14 $ 0.78 $ 0.54 $ 0.42 $ 0.24
Cash flow from operations $ 291,841 $ 217,246 $ 223,333 $ 110,480 $ 192,336
Operating Highlights
Same store sales growth(2)
Sally Beauty Supply 6.3% 4.1% 2.1% 1.2% 2.7%
Beauty Systems Group 5.5% 6.2% 1.0% 6.9% 10.1%
Consolidated same store sales growth 6.1% 4.6% 1.8% 2.6% 4.5%
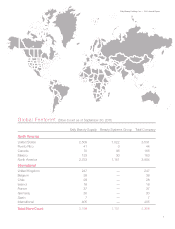
Number of stores (end of period)
Sally Beauty Supply 3,158 3,032 2,923 2,844 2,694
Beauty Systems Group 1,151 1,027 991 929 874
Consolidated store count 4,309 4,059 3,914 3,773 3,568
BSG distributor sales consultants 1,116 1,051 1,022 984 1,002
(1)Weightedaveragesharesforfiscalyear2007wascalculatedfromNovember17,2006throughSeptember30,2007,whichrepresentstheactualnumberof
days that shares of the Company’s common stock were publicly traded.
(2) Same stores are defined as Company-operated stores that have been open for at least 14 months as of the last day of a month. Our same store sales are
calculated in constant dollars and include internet sales (since 2009) and store expansions, but do not generally include sales from relocated stores.
Financial Highlights
4